Search This Blog

Friday, December 28, 2018

Why US Yield Spread Rises When Market Crashes?


27 Dec 2018
Tinyurl : https://tinyurl.com/ydbgtrxy

It is a common knowledge that investors are using yield curve to predict the health of economy.   If there is a recession coming,  one would expect yield curve to be flattened.  One reason is that the market is expecting Fed to raise its Fed rate in near term.  This will  push the short term bond yield up and flatten the yield curve.  

Yield Spread and Yield Curve

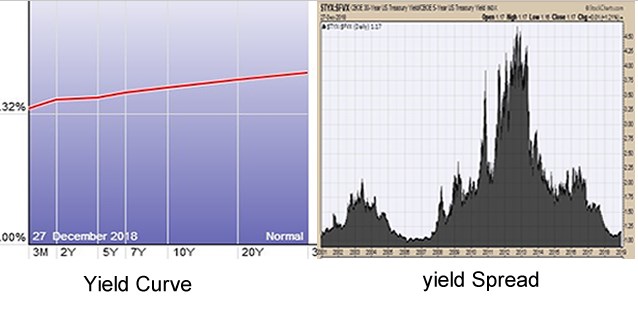
Yield Spread Curve and  Yield Curve are different.  Yield curve shows the yields of various type of bonds in a single day whereas the Yield Spread Curve shows 2 type of yields over a period as illustrated in the following pictures.

https://4.bp.blogspot.com/-qgeOkZ0xUAI/XCW4Pq6W16I/AAAAAAAADuU/aJ_zA6UtfXAy4iisVijqz_jen5lwhKZQACLcBGAs/s1600/2018-12-28_11h22_35.jpg
A yield spread curve is more useful as it can show not only the flattening yield;  but also,   it can show when that happened and how long flattening yield had lasted. 
 

The Yield Spread Curve

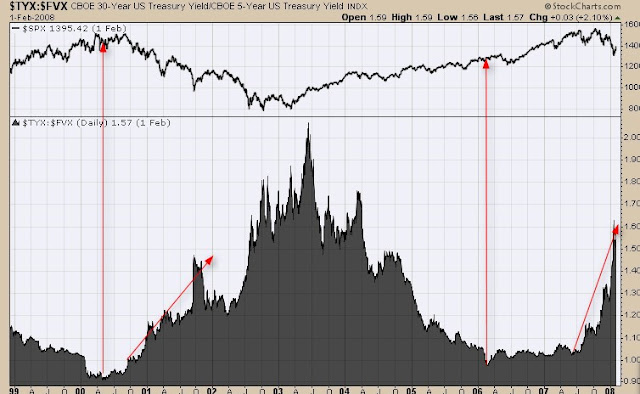
In the 2008 recession,  the 30:5 year yield spread curve flattened around Mar 2006 when the yield spread was at its lowest level.  But the stock market did not crash until Oct 2007 which is 1.5 years later.   In 2000,  the yield spread curve took the same beating with its lowest level around May 2000.  This one took less than 6 months to see  the market crash. 

What is Common About the Market Crashes?

Besides the flattening  yield curve,   there is one thing in common.  The yield spread curve always  rises as soon as the stock market started to crash.  This means that if there is a stock market crash,  there is an increasing  interest for investors to safe park their money in short-term bonds rather than in the long-term bonds.

Why is this so?

There isn’t much explanation one can found in the Web except this article written by  Beth Braverman in CNBC.com.  He explained that
  • The returns of short-term bond fund is more stable in rising interest rates and inflation environment;
  • Short-term strategies has lower annualised volatility,  less than stocks and long-term strategies;
  • Investors can cash back their money in a shorter time frame.
This make sense because if one expect the stock market crash to last only 1 to 2 years,  why lock their money in the long-term bonds which has  higher risk and volatility?  Moreover,  Fed is likely to cut the short-term rate during a recession and this will push up the short term bond prices.

How’s the Present Yield Curve?

The present yield spread curve looks very much like the 1999-2000 yield spread curve.  It is rising fast and appears to have a short flattening period.   

There are 2 observations

1.  The yield spread curve in 2008-2013 period rose to a peak of  about 4.5%,  more than twice the level in 2003.   This is probably caused by the 3 QEs that were introduced between the period from Nov 25 08 to 2013.

2.  The yield spread curve rose slightly  recently from 1% in July 2018 to about 1.7% in Dec 2018.

What is there to learn?

It is quite clear that the investors were trying to park their money recently in  the short-term bonds.  The more the money is parked in short-term bond,  the faster will stock market collapse under such movements.

What to do next?

Observe carefully how the yield spread curve develops through this link. Dump and run away from the stock market if the yield spread curve continue to rise higher and higher.   It is signalling to us that more investors are drawing out their money from stock market to park their money in short-term bonds.

Disclaimer:  This article is for information and  educational purposes.   Readers are advised to  conduct their own research and study to make their  own investment decisions.


Tinyurl : https://tinyurl.com/ydbgtrxy
Wednesday, December 26, 2018

Stock Trading Opportunities Under DoubleTop and Candlestick Gaps (Update)

Tinyurl :   https://tinyurl.com/ydxuwxnp

Update:  25 December 2018

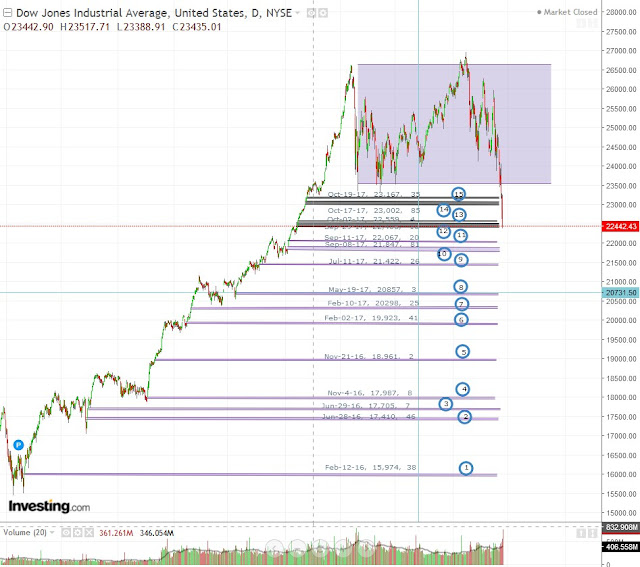
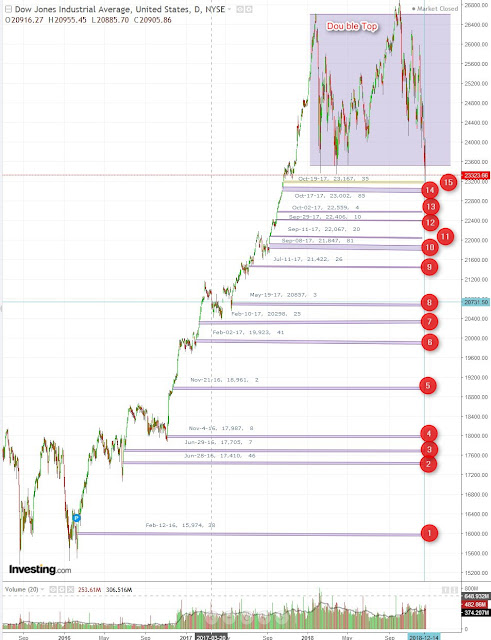
The dreadful 1/2 day trading on Christmas Eve has seen DOW index wiped off around 650 points or 3% from 22, 445. The index now stood at around 21,800. The nasty Christmas Eve fall covered up another 2 of the candlestick gaps, namely Nrs 10 & 11 as shown in the attached chart. 

(Doubleclick the chart to enlarge)

This 21,800 level is about 800 points from 21,000 or just slightly more than 1,300 from 20,500, which is 2 times the height of the Double Top Channel. According to conventional wisdom in technical charting groups, 20,500 to 21,000 would be the likely range for DOW to make a good rebounce to retest the resistances and the highs again.


Update: 22 December 2018

Out of the 15 candlestick gaps create after Trump announced his candidacy for President to the date DOW completed the Double Top, 4 candlestick gaps, namely Nr. 12,13,14 &15 as shown in this attached chart has been covered. There are still 11 more candlestick gaps left to be covered. (Double Click Chart to Enlarge)

https://2.bp.blogspot.com/-ndurILPPBig/XB2WM9-anLI/AAAAAAAADsQ/OlzOX9iQ5_kj0_ZLaJXjfutH5Dg3uyeXgCLcBGAs/s1600/2018-12-22_09h35_25.jpg


Update:  20 December 2018

An Excel sheet was built to determine just exactly how many candlestick gaps were created between the time Trump announced his candidacy for Presidency (around early 2016)  to the present date.  We were surprised to get the following results:-


Date
Gap low
Gap high
Gap size
1
Feb-12-16
15,974
16,012
38
2
Jun-28-16
17,410
17,456
46
3
Jun-29-16
17,705
17,712
7
4
Nov-04-16
17,987
17,995
8
5
Nov-21-16
18,961
18,963
2
6
Feb-02-17
19,923
19,964
41
7
Feb-10-17
20,298
20,323
25
8
May-19-17
20,857
20,860
3
9
Jul-11-17
21,442
21,468
26
10
Sep-08-17
21,847
21,928
81
11
Sep-11-17
22,067
22,087
20
12
Sep-29-17
22,406
22,416
10
13
Oct-02-17
22,559
22,563
4
14
Oct-17-17
23,002
23,087
85
15
Oct-19-17
23,167
23,202
35


There were a total of 15 candlestick gaps created over one and half years,  between Feb 2016 to Oct 2017.  The candlestick gap size ranges between 2 points to 85 points.  None of these are run-away gaps and therefore,  they are likely to be covered up sooner or later.

(double click for enlarge picture)

https://2.bp.blogspot.com/-owr1SRmHDwI/XBtD6eN0BrI/AAAAAAAADsE/U_WeHdXhQrgsoU2MBVixVh7ZzQ3tDI0pgCLcBGAs/s1600/2018-12-20_13h28_43.jpg


It is to be noted that gap-15 created on Oct-17-2017 has just been covered up by yesterday's market fall where DOW lost about 350 points or 1.51%.  The fall also broke the support at 23,500 and complete the forming of the double top pattern which often signify the start of the bear market.  DOW's next target will be around 21,000.

8 December 2018

There are lot of posts in the Net  written about DoubleTop and Candlestick Gaps stock trading patterns.  These patterns traditionally offer trading opportunities where one can determine how the stock would react in the coming days or months.  

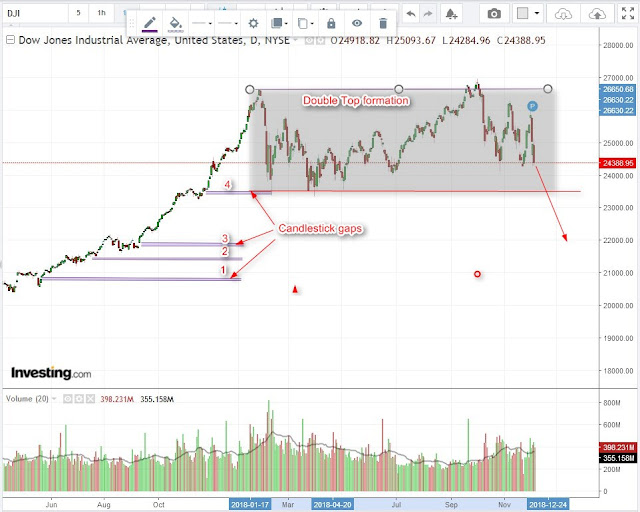
Presently,  DOW has created 4 candlestick gaps and about to form a Double Top after May 2017 as shown attached.  This article will discuss how one could seize the opportunity to trade the stocks and earn or save some money in stock tradings.


What is a DoubleTop?

DoubleTop is a trading pattern formed in the chart where prices of the stocks or indexes make two peaks over a period of at least 2 months with a usual price difference of less than 5% as shown in the above chart.   

The occurrence of DoubleTop pattern shows that the traders are not willing to trade above  the highest level attained as they do not  have confidence that the price will continue to go higher than that "highest level".   The next step these traders will take is to liquidate their position,  waiting for opportunity to sell their holdings into the strength of the market.

What is a Candlestick Gap?

Candlestick gap is another trading pattern that registered the willingness of the traders to push the price higher in the coming days or weeks or even years when there is a  good news.  For example,  if there is a significant event such as a company restructuring that attracts 10 or 20 times the trading volumes,  the market wisdom is to expect the price to hold above the gap price for at least 2 or more years.  This candlestick gap is often termed as “runaway” gaps.   There are also other types of candlestick gap patterns.

What happened in DOW recently?

DOW has created a total of about 4 candlestick gaps after May 2017 although there are also other candlestick gaps created before that.

The first (Gap 1 shown in chart)  was on 19 May 2017 where the market was told about good economic reports of declining jobless rate and also strong profit growth in  Wal-Mart Store and many other US companies having businesses overseas.

Then Janet,  the Chair of Fed,  reported that the US economy was strong enough to absorb gradual rate increases over the next few years in mid July 2017.  This propelled the stock to make all time high to close 21,532 with another candlestick gap (gap 2)  created.

After that,  some similar and  significant events also happened about the economic growth in the other candlestick gaps when stock price jumped to make historical high.  However, none of the 4 candlestick gaps have attracted significant changes in trading volume,  which means these candlesticks are just "ordinary" candlestick gaps which would be “covered” up within a period of less than 2 years.

As for the DoubleTop formation,  Apple announced on 30 Jan 2018 that it was cutting production of iPhone X by half from 40 million units to 20 million units.  This surprise announcement put a “lid” on the stock prices and the market remained stagnant for the next 9 months.  In-between,  US-China Trade War spooked the market.  This latest DoubleTop formation will be completed when  DOW falls below 23,500 in the coming weeks as indicated in the following chart.


Where do we expect DOW to go Next?

Should DOW fall below 23,500,   completing the DoubleTop formation,  the traditional market wisdom is to expect DOW to  fall to about 21,000,  which would officiate DOW entering the  Bear Market territories,  ending the 9-year bull market which started from March 2009.    DOW will also cover up all the 4 candlestick gaps described above.  

Whether DOW will continue to fall to cover the other candlestick gaps created before May 2018 is anybody's guess at the moment. 

Disclaimer:  This article is for information and  educational purposes.   Readers are advised to  conduct their own research and study to make their  own investment decisions.

==================================================================

Other similar article :  http://skyjuiceiswater.blogspot.com/search/label/stock

Tinyurl :   https://tinyurl.com/ydxuwxnp

Monday, December 24, 2018

How to Clean and Restore Ceramic Water Filter Medias?


24 December 2018

Most water filter medias nowadays are the disposable type.  The manufacturers often recommend to  to replace the filter media once every 6 to 9 months.  There are also special types of water filter that use ceramic as a filter media.  They are either in dome, dish or cylindrical shape.    

For these kind of filter medias,  the manufacturers often suggest to sandpaper the surface of the media with sand paper or rough sponge once it is clogged with dirt.


However,  after some operations, one would find that this cleaning method will no longer work especially in gravity flowing water filter like this type.    Water just refused to flow properly.

Why?

Water filter,  especially the ceramic filter,  has tiny little micropores to trap dirts and microorganisms of larger than 0.3 microns,  Micro living organism such as living microorganism,  fungi, microprobes or single cell living Eukaryotes are always present in water.
These microorganism can clog up the micropores of the ceramic filter media rendering it useless as water filter material unless they are be removed regularly.  Some of these microorganism will also release air that can sometimes be trapped in the micropores of the filter,  reducing the flow of water.

How to Remove them?

1.  Back washing or Priming the filter

If it is mostly air that is being trapped in the pores,  one could prime the ceramic filter using a soft rubber washer as shown in this video for the Berkey Filters.    However,  this method will need careful control of the water pressure or some ceramic filter can easily crack under such pressure.   Also,  this method has little or no effect in getting rid of living microorganisms.  

>

2.  Boiling the Filter

This method involves filling up the filter media with water and then water boil the filter under simmering heat.  

Step by Step

Description
Action
Remarks
1.   Filling the filter with water
1.  Put the filter under a tap and fill it up with water
2. use a chop stick or similar to “poke” the outlet hole until all the air inside the filter are released.
Fill the filter with full water

https://3.bp.blogspot.com/-bcrGsg11kkA/XCCImBIwaOI/AAAAAAAADt8/o2hcCmykdUoc74Gj2CMaRGvixMFc9lNfwCLcBGAs/s1600/2018-12-24_11h51_36.jpg
2.   Placing inside a pot
Place the filter upside down (i.e. with the outlet facing up) in a small pot and fill the pot with water,  making sure the filter is only ½ to 3/4 immersed in water

3.  Boil the water
Under simmering heat,  bring water to  boil for about 3-5 minutes.   Using a small straw to pick up some boiling water from the pot  and transfer the boiling water slowing into the outlet hole of the filter to ensure the water is always full inside the filter
The topping up of the boiling water inside the filter media will ensure there will be  a water pressure to force the microorganisms eventually out of the micropores under  gravity. 

Precautions

1.  Always make sure the filter is half or 3/4 immersed in hot water and never allow hot water to touch the  plastic part of the filter.  This is because the boiling water can damage and distort the shape of the plastic;

2.  Never lift the filter from boiling water by holding the base of the plastic as the base can be easily dislocated from the filter.  This is because the boiling water that heats up the ceramic may soften the hot glue that is used to hold the plastic base to the filter;

3.  Handle the hot water with care.  If needed be,  use an electric fan to cool the pot and the filter media together before removing the filter from the pot.

Results 

This filter shown in the video has not much water flow before the boiling water treatment.   Now it is flowing about 75 drops of water per minute.

  =========================================================

tinyurl:  https://tinyurl.com/y9crukdz


Saturday, December 22, 2018

Why the Present Stock Market Correction Can be Catastrophic ?


22 December 2018

Nowadays,  many websites that predict stock market trend are pointing towards one direction i.e. the present stock market will go down and the correction will be quite serious.  However,    none has a good answer just how serious it will be and why it will be so?   This article intends to throw some lights to explain why.

How? 

Just by using trading volume in NYSE.

Why?

We all know that trading volume is important when we analyse the stock market.   If there is an up market,  there must be up trading volume to support it;  otherwise,  this market will not last very long.  Similarly,  if there is down market,  the down trading volume should also reflect the same.

What if not much up and down volumes?

This will mean there isn't much trading volume to support the market.  Market will soon “collapse”,  whether it is going up or going down.

How to get the information?

If one care to take a look at any historical data or chart of any stock exchange,  one should be able to see volume.   It is always plotted as a bar chart at the bottom as shown.  


This volume bar chart that shows the total trade volume will not tell how much of the volume was  buying up and how much was buying down the market.   

Fortunately,  freestockchart.com has already prepared such an up and down volumes and plotted them as  NYSE UP Volume Index and NYSE Down Volume Index.   For example,  the following chart is a "NYSE Up Volume Index" chart.   However,  this chart  is not very useful.


If we hide the daily data and use the chart's 20-day MA to plot from year 1966 to date,  one could immediate see a pattern began to form as shown attached

IT IS A SURPRISE TO SEE THE PRESENT RALLY AFTER 2010 IN NYSE HAS NO SUPPORTING UP TRADING VOLUME!!!

This is also true for the down trading volume


What Do All these Mean?

1.  The retail investors have not much  confident in the stock market after year 2010 and after the market picked up in March 2009; 

2.  One could see that the trading volume spiked up to 4,500 billions in the 20-day, indicating many had taken the opportunity to sell into the strength of the 2009 market before leaving the market;

3.  The market picked up most trading volume after 2002 when the trading volume increased to a level above the NYA index.  This is mainly because of the explosive use of the Internet facilities to increase the trading accounts.


Gallup,  the organisation that polls and provides statistical results has this following chart to show.  The chart shows the US Adult traders increased from 58% in around year 2000 to a peak of 65% in 2008.  Thereafter,  many left the market and the US Adult traders dropped to 52% in 2016.   This Gallup’s chart supports the reason why the market has diminishing volumes after 2008/2009.  


Why Market Still Keep Going Up?

Mr.  Ben Bernanke who had “engineered” the Quantitative Easing (QE) in 2008/09  must have the correct answer when he “flooded” the market with liquidity that was available only to the big players such as Banks,  Institutions and other big financial users.  These few players,  having “loaded” with excess liquidity,  was probably given the “permission” to  also “flood” the stock market.  One thing they could have done was to push up the stock prices without pushing up the trading volumes. 

What will happen next?

Your guess is probably better than mine.

What we should do next?

Watch carefully how Fed reacts in its “liquidity tightening” exercise and how Fed reduces its balance sheet.  As Fed reduces its balance sheet,  it will also “pull” money from the market and “destroy” them.  This will “clip the wings” of the Banks,  Institutions and other big financial users.  It would bring the stock market to its knee.

Therefore, it is always good to pay attention to the trading volume and analyse why there is an abnormal increase or reduction  in the trading volume.  Also,  one should pay good attention to track the margin loans that investors (including banks and institutions ?)  borrowed to prop up the market.     
Wolf Street has just reported that about $1.3 Trillion “Leverage Loans” increased since 2014 might just  come “Unglued”.


Disclaimer:  This article is for information and  educational purposes.   Readers are advised to  conduct their own research and study to make their  own investment decisions.
============================================================
tinyurl :   https://tinyurl.com/y9h9gydw


Simple and Easy Way To Backup Photos, Movies and Documents from handphones

 2 December 2023 In the past,  we used iTunes when we wanted to transfer or backup our photos,  movies, and documents from iPhones or Androi...