Search This Blog

Monday, July 31, 2023

SembCorp (U96) Establishing S$5,000,000,000 EURO MEDIUM TERM NOTE.

31 July 2023


SembCorp Industries (SCI) just announced that it has established a S$5,000,000,000 Euro Medium Term Note (MTN)  Programme today and DBS Bank Ltd. has been appointed as the sole arranger and dealer under the Programme.   This MTN is guaranteed by SCI.  Henceforth, SCI’s subsidiaries,  together with SCI  may raise money from this MTN from time to time, subject to certain conditions having been fulfilled.


What is the difference between MTN and Bonds?

Both MTN and Bonds are instruments to raise funds except MTN is simple to issue because it is a discrete fund between the 3 parties,  the issuer,  the agent, and the investor.  On the other hand, the issuing of bonds will need a public offering. In the past,   the issuing of bonds had often been perceived as the company was in financial distress.

MTNs are usually sold in small amounts, either continuously or intermittently.

Some companies still prefer to issue bonds because it is more cost-effective;  also,  the bonds allow investment banks to buy the entire issue from the companies and then sell it to the public to earn commissions, etc. The risk of selling is therefore transferred from the companies to the investment bank. 

For more information,  please refer to this article.


How will it affect stock prices?

As MTN are like Bonds,  they are instruments of debt.  They will invariably affect stock prices.   But,  the effect of MTN is usually much less than Bonds for the main reason that a public offering of bonds often gives the impression that the company is in distress.   On the other hand, MTN is usually carried out discretely.   Presently,  SCI is only establishing the MTN program.  There are no raising of any debts mentioned.  

The effect may be more only when traders are aware of the real purpose for raising the MTN is not for expansion but for debt servicing. 


Examples

When SCI established a S$3 billion Multicurrency Debt Issuance Programme on April 3, 2020,  it caused little or no reaction to the SCI’s prices as shown in the attached chart.  Also,  we have observed no appreciable reactions when SCI or its subsidiaries issued Notes or debts in other periods using this instrument.  

This is also the case when SIA established its $10 billion MTN during the pandemic.  It is only when SIA issued a bond from the MTN that sent the stock price tumbling by as much as 20%


Given the above,  we do not foresee that this S$ 5 billion MTN established by SCI will have any material impact on SCI’s trading price at the moment. 


Disclaimer:  This article is for information and educational purposes.   Readers are advised to conduct their own research and study to make their own investment decisions.


Other Related Articles

SembCorp Technical Analysis from 4 July to 28 July

Saturday, July 29, 2023

SembCorp Industries Singapore Technical Analysis

28 July 2023

For the last 2 trading days,  SembCorp’s price has tried hard to recover from its recent fall caused by the termination of Sembwaste’s divestment plan.   The price movement has almost covered up the candlestick gap created by the last fall except it fell short of S$ 0.01 as shown in this attached chart.    


Going forward,  we are expecting SembCorp’s price to range-bounced,  testing either the Trendline T1 or Trendline T2 while waiting for the 1H 2023 results to be announced on 4 August 2023.


Technical Analysis

Technically,  SembCorp’s price is trapped in a horizontal symmetrical triangle as shown in the attached chart.  SembCorp’s price can either fully recover from the recent fall if the price can break Trendline T1 or continue to fall for lower lows.  It can even test the various price support lines until it reaches the price when SembCorp first announces the divestment of Sembwaste.  Meantime,  we rexpect SembCorp’s price to go sideways until the 1H 2023 result is announced on 4 August. 


Why the Candlestick is not fully closed?

The trading on 27 July had almost closed the candlestick gap except for the gap of S$0.01 which is awestrickening to many traders.   This is because the filling of a gap is just about 1 or 2 keystrokes away.

The only description that could fit SembCorp's trading pattern is the "Downside Tasuki Gap pattern".    

In a Downside Tasuki gap pattern,   the Bears will push down the price so strongly to form a candlestick gap on the first day.   The Bulls will then try to push the price up the next day,   But they failed to cover the gap convincingly.  If the subsequent attempts also failed to cover the gap,  it would mean that the bulls have likely fleed and the price would continue to fall.   


We are now observing and monitoring if this Downside Tasuki Gap is the right trading pattern for SembCorp and if a good SembCorp's 1H 2023 will negate this downtrend.


26 July 2023


Today, SembCorp’s price dropped to close at S$5.46.  This price is near to what we had expected earlier.

The following chart suggested that there is a Support S2 that SembCorp’s price might want to test next. There is also a trendline T2.


Will the price continue to fall?

The price drop today is S$0.20 or 3.36%.  Is this price drop done? Has the price drop taken care of the capital gain for the disposal of SembWaste?    

To answer,  it would be good to know what is the “weight” of the disposal deal and how much it will be worth in turn of stock price.  

1)     The CGS-CIMB Target Revision

To start off,  we noticed Business Times has an article report about CGS-CIMB revising its target after hearing about the SembWaste disposal news on 5 June. 

The report said:

a)  CGS-CIMB has upped its price target for Sembcorp Industries 3.36% to S$6.20 from S$5.12 following news of the group’s potential divestment of its waste management business, SembWaste;

b)  The disposal is estimated to have a divestment gain of S$225 million to S$250 million.

In other words,  CGS-CIMB expected SembCorp’s target lifting price to be S$1.08 if SembWaste was disposed of.  The divestment would add some S$250  million as capital gain.  

2)     Converting the Estimated Divestment gain of S$250 million

As the S$250 million is a gain or earning.  It must be converted to share value for comparison purposes.

There are presently 1.7 billion SembCorp shares in existence.


This S$250 million will work out to be S$ 0.147 (250 million/1.7 billion) per share.  The PE ratio on 5 June was 11.9   Rightly speaking,  this S$250 million divestment gain when converted to share price is S$0.147 x 11.9 or S$1.75.  This S$1.75 is higher than the CGS-CIMB’s target lifting price of S$1.08.

Therefore,  if we were to base on CGS-CIMB’s estimation and if there is correction,  we would have to move the final target priceby S$1.08 to S$4.57 as shown in the attached chart.  This target price was close to the price at which the divestment of SembWaste was first mooted on 9 May.  


Will the Price Ever Recover?

The answer is definitely a yes. This is because there is a big and glaring candlestick gap of about S$0.16 as shown in the following chart.  This gap was created with a moderate trading volume.  This gap can be considered as a normal gap which will be covered in due time.  


When will the Gap be Covered?

This will be everybody’s guess.   If the price is to drop further in days to come,  we might expect the price to move slowly down testing the various supports.   We also expect the gap will not be covered within a week unless there is other good news coming ahead before or after the 1H 2023 result presentation on 4 August

As the candlestick has already tested and bounded from T2,  the price might want to make an attempt to cover the gap,  failing which it would want to fall back and  retest T2 again,

Disclaimer:  This article is for information and educational purposes.   Readers are advised to conduct their own research and study to make their own investment decisions.

25 July 2023 

After the trading hours, SemCorp announced it would drop the plan to sell its waste management company,  Sembwaste.  

On May 9,  when Reuter said there were interested parties to buy Sembwaste, SembCorp's price went up by 3.1% or S$0.14.  It hit an all-time high.  But when SembCorp came out the next day to clarify that there were no definite deals to sell SembWaste,  the stock price dropped back immediately as shown in the following picture


However,  Straits Times in its news on 10 May added that “the first round of non-binding bids was expected to be early June. This might have given hope to the traders that the discussion would be ongoing,  The price continued to climb.  So,  when SembCorp announced again on 5 June that the sale discussion had begun, SembCorp's price jumped 2.9% to close at S$ 5.34 on that very dayGivenof the above,  we are expecting SembCorp's price to drop around 2 – 3 % tomorrow.


Technical Analysis


Technically,  we found SembCorp having great difficulties crossing over the T1 and T2 to make a higher high.  The traders might be waiting for the result of the discussion on SembWaste disposal.  

Since the disposal of SembWaste has been terminated,  we will expect SembCorp's price to test S1 and maybe S2 too. 


Disclaimer:  This article is for information and educational purposes.   Readers are advised to conduct their own research and study to make their own investment decisions.

8 July 2023

Yesterday,  we saw traders continuing to sell SembCorp shares and ignoring JP Morgan’s unsupported assumption about SembCorp's earnings. This event was reported in the 7th July article.   Yesterday's price action reflected that the traders were expecting a pathetic market to come ahead rather than worrying about SembCorp's performance.  

Yesterday's price dropped to about S$5.12 which is shown as support S2  in the following chart.  The price then recovered more than 2/3 of the morning drop and closed at S$5.31,  just managed to recover the support at S1. This S$5.31 is 1.3% or 7 cents below yesterday’s closing price of S$5.38.


Because the price support at S$ 5.38 had been broken,  SembCorp's market sentiment has now changed from bullish looking to slightly bearish looking.  This is because the price is now closer to the trendline T1 as shown in the following chart.    


If this trendline T1 support is to break for some reason,  we would expect SembCorp to find lower lows,  testing S3 and S4 before going down further. 

On the other hand, we noted the strong recovery of Friday's price movement after hitting the TI trendline.  It could be due to traders wanting and preparing to account for the hefty drop on 6th July caused by the unsupported assumption made by JP Morgan to set its target price.

Going forward,   we hope the support S1 would hold.  If SembCorp can break the resistance R1,  we should see SembCorp attempting to make higher highs.  


6 July 2023

SembCorp's price has broken the rising channel as described earlier on 4 July.  The price fell 4.95% from yesterday's S$5.66 to S$5.39 or a total loss of S$0.28 in today's trade.


What had Happened?

The price took a tumble today because JP Morgan Singapore has set a target price of S4.50.  JP Morgan said that SembCorp:

a)  Is trading at 11 times its EBITDA;

b) Singapore's electricity tariff has peaked.

It claimed that Conventional power generation had contributed about 85% of SembCorp’s earnings,  JP Morgan was convinced that SembCorp’s earnings would be significantly affected when Singapore revised the electricity tariff downwards.  It has also been said that SembCorp’s price has risen more than 70% this year but it added that inclusion as a component in MSCI Singapore is a positive catalyst.

The attached was an extract from Sharejunction as the original JP Morgan report could not be located by googling


For the trading day,  SembCorp’s price dropped sharply after the opening. It reached a low of S$5.30 momentarily just before noon and recovered to close at S$5.38 as shown in the attached.


About SembCorp’s Power Generation Portfolio

It is true that SembCorp’s income from Conventional Power generation like the Co-generation plant in Sakra,  Singapore,  is contributing roughly about 85 % of Sembcorp’s earnings.   The breakdown is as shown in this picture extracted from SembCorp’s annual report 2022.


But SembCorp has under its management a total generating capacity of about 12,600 MW, of which 2,600 MW are renewable energy plants according to this Wikipedia.   For the remaining 10,000 MW of conventional energy plants,  SembCorp only has  only two gas-fired cogeneration facilities (totaling 1,219 MW)  in Jurong Island. Singapore.   

In other words,  the conventional energy plant in Sakra is contributing to a small part of SembCorp’s earnings in 2022.  Therefore,  JP Morgan’s reasoning about SembCorp’s earnings would be greatly affected when Singapore revises the electricity tariff cannot be entirely supported.  


Technical Analysis

The following chart shows that SembCorp’s price has broken the resistance @ S$5.38. This resistance has now turned into support for tomorrow’s trading session.  Therefore,  if SembCorp’s price can stay above this  S$5.38 support S1 from now on,  there is a good chance for SembCorp to scale higher high and make an attempt to cover the candlestick gap G1.


 4 July 2023

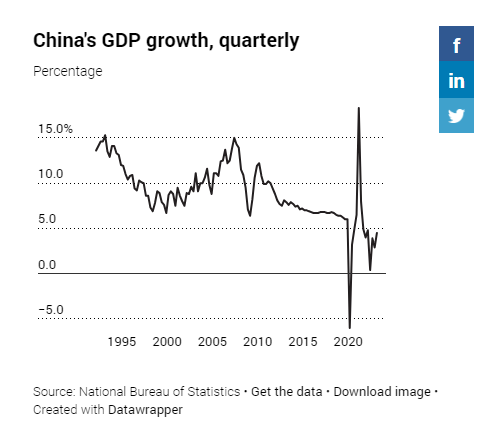
SembCorp Industries Pte Ltd (SCI) is one of the favorite hot stocks on the SGX Stock Exchange.  It has almost doubled its price since the end of 2022,  just before China reversed and ended its "Zero Covid policy.

Today,  it has nearly recovered all its previous shines and it is poised to make an all-time high price as shown in this monthly chart


What the Brokers and Analysts Said?

Most broker houses and Analysts have a good rating for SCI with recent target price averages over S$6/= as shown in this picture from sgInvestor.io


The Recent Price Movement

SCI is technically bullish except for the recent fall caused by EMA's announcement about the Temporary Capacity Cap (TCP) on 19 June 2023.  As most investors are not familiar with TCP, they sold their holdings probably on "Sell now ask later" mode to protect their capital.   This caused SCI to lose a total of about S$0.52 or about 9% on 20 June 2023.  When they realized on the next trading day that TCP did not have any material impact on SCI's operation,  the price gradually recovered from S$5.15 to today's S$5.69-S$5.72.


Technical Analysis

The SCI's hourly Technical Chart is shown as follows.


The chart shows that the SCI price has been trapped in an up-rising channel.  It has just broken the resistance S1 which has now turned to become the support.   SCI will likely stay within the price channel until it breaks R1.  As long as SCI's price can stay above the lower trend line (shown in red) and above the support S1,  there is a good chance for SCI to break R1 and seek higher highs.

Disclaimer:  This article is for information and educational purposes.   Readers are advised to conduct their own research and study to make their own investment decisions.


Wednesday, July 26, 2023

SingTel (Z74.SI) Technical Analysis

26 July 2023

SingTel had a tough time after reaching an all-time high of S$4.40 in the middle of 2015.  The stock price then fell to a low of S$2.20 during the pandemic.  This is a total discount of about 50% from its high. 

SingTel suffered a large drop in price in 2015/2016 and then again in 2019.  The drop in 2015/16,  according to the analyst,   was caused by the rising interest rates in Singapore as well as a fall in AUDSGD dragging down Optus's earnings.  The fall in 2019 was caused definitely by the Pandemic.

Thereafter, SingTel's price was stable.  It climbed as high as S$2.80 in the middle of 2020 before dropping to the present level of S$2.60 in recent weeks as shown in the following chart.


Technical Analysis

In the longer term,  we are expecting SingTel to do a better job than before as shown in the following weekly chart. 


This is because we are seeing SingTel's price rising its head above the Trendline T1. This indicates that SingTel is about to scale higher high.   On its way up,  we might expect some setbacks. But as long as the price can keep above Trend T1,  we are expecting SingTel's price to go higher.

In the shorter term,  we can also see SingTel's price not only rising above T1, but It has also escaped from the bearish rising wedge,  W1,  in the last 2 trading sessions. This provides an opportunity for traders to enter the market.


Going forward,  we expect SingTel's price to test the resistance R1,  R3, and R3.  Resistance R1 appears to be a very strong resistance.   We hope SingTel can recover its previous glory.  


Disclaimer:  This article is for information and educational purposes.   Readers are advised to conduct their own research and study to make their own investment decisions.


Saturday, July 22, 2023

Singapore Stock: Keppel Corporation Limited (SGX: BN4)

21 July 2023

Today,  Keppel Corp’s trading price dropped from  S$6.96 to S$6.79.  This is a loss of S$0.17 or 2.44% from Thursday's closing price. It is the largest price drop in 2 weeks since 6 July.

The news today about the Keppel Fund has acquired a building in Seoul for an undisclosed sum must have been responsible for the drop in today's price.   

About the Acquisition


With this latest acquisition,   Keppel claimed to have about 1.4 trillion Korean won ($1.5 billion) worth of deals in South Korea since 2021.  The total assets in South Korea under its management (which includes the Samhwan Building and waste management company, Eco Management Korea Holdings) are now about 2.6 trillion Korean won or S$ 2.6 billion.

The Estimated Cost of the Acquisition 

According to Google Search,  Keppel Corp has made the following deals since 2021

a) The acquisition of Samhwan Building 

This building was acquired in 2022 for a sum of about KRW220 billion ($228.7 million).   It is located in the Jongno central business district in Seoul.  It is a 15-story building that has a total gross floor area of 31,403 square meters. 

         b) The acquisition of Waste Management Company

c)  The acquisition of the Sheraton Seoul D Cube 

Keppel Investment Management, the South Korean arm of Keppel Capital Holdings, purchased Sheraton Seoul D Cube for KRW131.7 billion ($117.9 million) in Novermber 2021.  It intended to turn the hotel into a commercial office building.

Therefore,   one can roughly estimate that the Sogong Annex could have cost Keppel around S$480 million (S$1.5 billion - S$230 million - S$666 million - S$120 million) unless there are other acquisitions not found by googling.

Unit Cost of the Acquisition

If S$480 million and the gross floor area is 15,750 sq meters,  the unit cost per sq meter for this acquisition will be S$30,000 per sq meter.  This will be the most expensive building Keppel has purchased so far in Seoul.  

In comparison,  this building is more expensive than Singapore's Shenton House in CBD which has a unit cost of about S$13,000 per sq meter,  In the details of a recent collective sale,  the reserved price put up was S$600 million.  The Shenton House building has a gross floor area of 48,000 sq meters.  

However,  we could not use this Singapore's unit measurement to judge if the unit price of Keppel's latest acquisition is expensive. We will explain more when we talk about the "takeaway".

The Locations of Buildings

The exact location of the Sogong Annex and Samhwan Building is shown in this Google map.   Songang Annex is right in the center of the CBD area and very close to the Seoul Tower.  It must be in the very prime area which demanded a higher unit price.


Why the Price Drop?

As the actual acquisition price of the building was undisclosed and most were not familiar with the property prices in South Korea to assess if the purchase price was fair and reasonable,   many traders must have been working on the “sell first,  talk later” mode to protect their capital.   


Technical Analysis

The following chart shows that Keppel Price has almost broken the trendline T2 and was up and running to scale higher high until this news about the acquisition of the Seoul facility broke up on 21 July 2023.    The news sent the Keppel price below Trendline T2 and is now preparing to test Trendline T1 again after bouncing from it on 7 July. 


Going forward,  we are expecting Keppel Price to test the support at S1 first.  If S1 failed to hold,  it will want to test again the support at T1. 


The Takeaway

a)   Price of Acquisition

The acquisition may be a bit frightening at first sight,  especially when the price was undisclosed.   The information was not properly and clearly articulated as to how such an acquisition could have affected Keppel’s future business.     

There must be good reasons why Keppel decided to buy the Sogong Annex although it is much more expensive than the price of Samhwan Building which it acquired in December 2022.  This is because the location of Sogong Annex is in a very prime area.  It is just about 1.3 km from the Seoul Tower.

According to this Korean economic news, office building prices in downtown Seoul set a fresh record high in 2021.  The highest unit price at that time surpassed KRW 40 million per one pyeong or 3.3 square meters.  This is around S$120,000 per sq meter.  This price is almost 4 times more than the S$30,000 per sq meter paid by Keppel for the Sogong Annex building as shown in the following table


b)  The Assets under Management (AUM)

Presently,  Keppel’s business is spreading across 6 areas of the Globe as can be seen from the following photo extracted from Keppel’s 2022 annual report


It can be readily deduced that these assets under management (AUM) in South Korea are just a small part that contributed very little towards the revenue of $6.6 billion in 2022.  The biggest part of more than 80% comes from businesses in Singapore.   Moreover,  Keppel Capital presently has S$50 billion of Assets under its management (AUM) and they are working toward a target of  S$200 billion of AUM.    The S$480 million for this acquisition of Sogong Annex is less than 1.0% of the S$50 billion of AUM.

c)  The Office Rental Price in Seoul

Although the housing market in South Korea was not as rosy as before and the price of housing properties has dropped since 2022,  there are reports that the price had stabilized in June as buying of properties in Seoul improved.   

As for the office rentals,  the latest report from Cushman & Wakefield said that the good office space vacancy in Q2 remained steady at 2.6% and the average monthly rental continued to rise at a rate of 1.2% YOY and 8.4% QOQ.


d)  Properties Sold with Gains

Keppel was able to make money from the property business in Seoul in the past few years after acquiring and value-adding the 3 Grade A buildings in Seoul in 2019.  They sold the 3 buildings away in 2021 for a handsome profit.  


Conclusion

In conclusion,  we do not foresee the acquisition of the Sogong Annex will have much material impact on the coming earnings of Keppel Corp.   Also,  we cannot conclude that the price of the latest acquisition of the Sogong Annex by Keppel is expensive.

Disclaimer:  This article is for information and educational purposes.   Readers are advised to conduct their own research and study to make their own investment decisions.


9 July 2023

In the article dated 5 July, we wrote about Keppel’s price being trapped in a rising expanding bearish wedge as shown in this weekly chart.

Since then,  the price has been further developed when we revisited it on 7 July.  

 (Note:  Corrected using adjusted price.  The original chart using investing.com was not adjusted for distribution in Specie of Sembcorp Marine share)

We can see from the newer chart that Keppel’s price is about the test the trendline support T3 very soon.  If it can bounce from this trendline support T3,  Keppel's price can be very bullish. 

On the other hand,  if the price took a turn for the worst for some unknown reasons, and the prices were to break the trendline support T3,  things could turn ugly.  Trading after that can be very volatile especially when the trading volume is large at a time when it breaks the trendline.  This is because the trendline T3 is one very strong support.  It is a Head and Shoulder line. When that happened,  we would expect Keppel's price wanting to go lower lows. 

In the daily chart as shown below,  we saw the price has broken the orange T2 trendline.  It has turned trading sentiment bearish and traders are expected to bring the price down to test the strong Trendline T3 as discussed earlier.


Going forward,   we hope Keppel's price can bounce after hitting the trendline support T3.   This is because many broker houses have higher targets.  In addition,  Keppel has signed recently to work together with Petronas Malaysia's Gentari to develop renewable energy projects.  Presently,  Malaysia has an ambitious renewable energy target, aiming to reach 70% of renewables in the power mix by 2050.   This target is slightly bigger than the target set by Indonesia which is 2/3 power mix by 2050. 


5 July 2023

Keppel Corporation Limited (SGX: BN4), in short,  KepCorp,  is one of the pioneer companies in the SGX exchange.  It was incorporated on 03 Aug 1968 and listed in SGX on 24 October 1980.   The group was originally in the offshore and marine engineering and construction services.   It has now expanded to become a global investment holding and management company and the operator of infrastructure, power stations,  district cooling, and other business like real estate in Singapore as well as in many other countries like China and Malaysia.  

Present Price Trend

KepCorp has a bullish trend at the moment.  This weekly chart shows that It has broken the red trendline in early 2022. This red trendline has been trapping KepCorp's price movement for the last 8 years since 2014.    KepCorp's price is now moving in an uprising and expanding wedge,  enclosing by trendline T2 and T3 as shown. 

(Note:  Corrected using adjusted price.  The original chart using investing.com was not adjusted for distribution in Specie of Sembcorp Marine share)

StockTarget Date

KepCorp is presently trading in SGX for about S$6.60 per share.  The target price of most broker houses and analysts is in the range of S$7 to S$9 as shown in this sgInvestor picture.


Present Stock Movement

KepCorp's price is presently trapped in an up-rising channel as shown in the following daily chart.  It has a resistance (R1) at S$7.11 and a supporting price  (S1) at S$ 6.53. We expect YZJ will move within the channel marked as T1 and T2.  If KepCorp's price can break T1,  we should see higher high prices; otherwise,  we should expect the price to move lower. 


For information,  we have also found an additional trendline that might show how the price will move in the shorter term. This trendline, marked in orange,  will guide the price movement in the meantime.   If the price were to break below this orange trendline,  we should expect KepCorp to test the support at S$ 6.23 (S2)


The Candlestick Gap

Just like SembCorp Industries,   KepCorp has a price shock on 19 June 2023 when EMA announced a temporary power cap for power generation in Singapore. In this event,  KepCorp has created a candlestick gap in the 60-minute chart as shown in the following chart.  In addition to the gap created on 16 June 2023 for the removal of Keppel DC REIT from the Straits Times Index (STI), KepCorp has a total of 2 candlestick gaps to cover.  

As these gaps are not "runaway gaps" and not created because of significant events happening in KepCorp,  they will be filled soon according to the textbooks.  Therefore,  we are expecting KepCop's price to move up to cover these gaps in a matter of time.


Stock Market Performance

KepCorp's stock price was not performing as well as its peers like SembCorp industries.  This can be seen from how the price recovered after the recent fall caused by EMA's temporary price cap announcement.   

SembCorp Industries's price has almost recovered whereas KepCop's price is still hovering below.  This is despite the broker houses and Analysts having given equal ratings as they gave the same to  SembCorp.

The main reason could be that KepCorp was more exposed to China.  As a result,  it has reported a deeper-than-expected drop in net profit for the year 2022.  Its net profit dropped to S$927 million ($709.91 million) for the year ended Dec. 31, from S$1.02 billion a year ago.  But its 1Q 2023 quarterly result was better than expected prompting many analysts to upgrade their ratings.

The market traders, however, have different views especially after it was reported that China's economic recovery rate was not as good as expected.   

Hence,  Going forward,  we do not expect KepCorp's prices to leap and bounce like SembCorp did unless KepCorp can reduce its exposure in China or China has improved its economic outlook in the coming months.

Disclaimer:  This article is for information and educational purposes.   Readers are advised to conduct their own research and study to make their own investment decisions.

Simple and Easy Way To Backup Photos, Movies and Documents from handphones

 2 December 2023 In the past,  we used iTunes when we wanted to transfer or backup our photos,  movies, and documents from iPhones or Androi...