Search This Blog

Monday, May 23, 2022

The Rate Hike and Quantitative Tightening

20 May 2022

Jump to 

 1)  Why QT Now & Not Later
 2)  Rate Hikes & the Market in the 1970s
 3)  How Market Responded to QT (1 July 2022)
 4)  Update: Market Responded to QT (26 July 2022)
 5)  Update: Market Recovered? (26 July 2022)

Search for stock articles in this blog

The US stock market is very sensitive to the news and announcements about  U.S. Federal Reserve (Fed)'s monetary policies,  be it Fed Fund rate hikes or cuts or quantitative easing (QE) or tightening (QT).  The stock market price will go up when there are rate cuts or QEs and vice versa.  

This time around, Fed announced it will increase the Fed Fund rate hikes 6 or 7 times until the inflation is tamed.  It will also carry out the QT at an increasing pace.  Fed had carried out similar rate hikes and QT also in 2015 except this time around,  the global economy is not looking as good. 

This article will try to discuss how this round of monetary policies will affect the US as well as the stock market.

What happened?

Prior to 2020,  the stock markets had their glorious days.  These all came to an end when Covid broke up the pace in early 2020.  The US has the highest Covid infection rate and many people died.  The global economy took a tumble with many countries having negative GDP growth in the 1st quarter of 2020.    

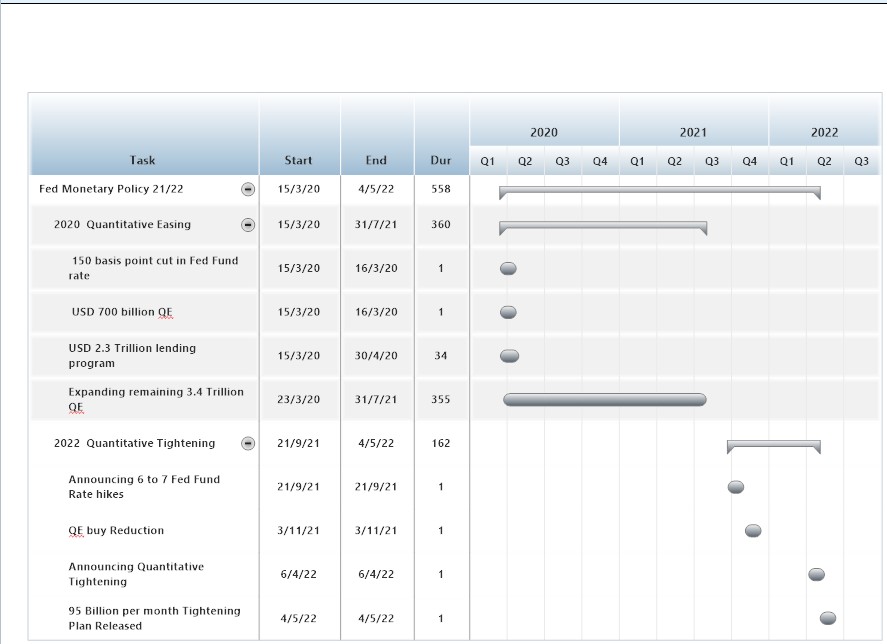
On March 15, 2020,  the US Government took the initiative to pump over USD$700 billion into the US monetary system to rescue the economy.  Later in the year,  it made available USD2.3 Trillion for the lending program and expand the QE program with USD3.4 Trillion money for an unlimited period.    

This 3.4 Trillion stimulus package of 2020 set the stock market on a rally; unfortunately, it also caused the US's inflation rate to rise quickly from an average of about 2.5% in 2020 to the present 8.5% in 2022.  

To curb the rising inflation,  Fed announced in September 2021 that it would raise the Fed Fund rate 6 or 7 times in a controlled manner.  At about the same time,  Fed also announced that it would reduce the QEs/  In May 2022,  the Fed came up with a QT plan indicating that it would reduce the size of its balance sheet by up to USD$ 95 billion per month until further notice. 

The following is the table showing the detail of the rate hikes and QE/QT plans carried out or to be carried out in 2020/22.

How the Stock Market Reacted?

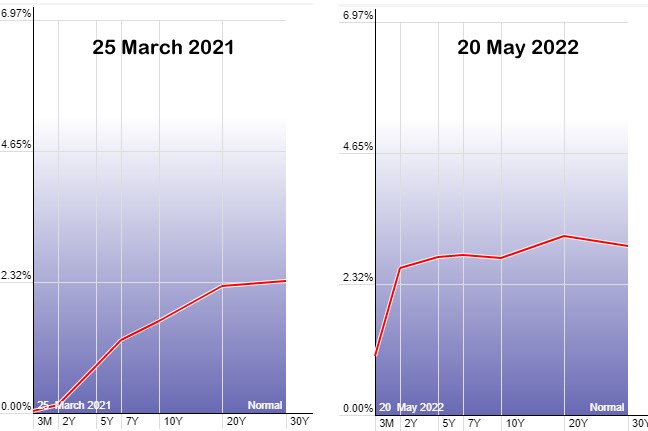
These Fed's rate hikes and QT plans put the "nails" on the US stock market's "coffin", sending the US stock market tumbling an average of more than 15% to date as shown in the following chart.

Why was the US's Inflation rate Rising?

It is known that printing money indiscriminately for citizens to spend will cause the inflation rate to rise.  For years since 2008,   the US Fed has been said to "Print" a lot of money under its QE programs but these QEs are for lending programs and they have never caused the US inflation rate to rise.  The last QE of USD3.4 Trillion in 2020 was given out for the US people to spend to tie over the Covid pandemic.  This last QE raised the US's inflation rate from an average of 2.5 in 2020 to about 8.5% in 2022 as shown in the following chart.  


How Stock Market Reacted to Rate Hikes?

It was the conventional belief that Fed rate hikes will increase business capital costs and will affect the economy and slump the stock market.  However,  this was never the case in the past years when the borrowing cost was low & the economy was growing as shown in this chart. 

Later,  on 3 November 2021,  Fed announced that it would taper and cut the size of its balance sheet through QT,  This announcement set the stock market tumbling.  

Why the Tapering and QT?

If rate hikes can curb the rise in the inflation rate,  why the need to do monetary tapering and QT?   

There were no clear answers from Fed.  Maybe the QE was never intended to be part of the permanent monetary system when the last Fed Chairman,  Mr Bernake,  introduced it in 2008/09.  It was meant to be a temporary measure to rescue the failing economy during the "Great Recession" in 2008/09.  It was supposed to be removed later and the money to be destroyed when the economy recovers.   

When was the last QT?

Fed had planned to start QT in 2018 when it was thought to be the right time.  The market sentiment was good and the US's economy was on the rise.  But Fed removed the QT program in 2019 as it sensed an economic downturn caused by Covid that was spreading quickly in China.   


QE,  the Catalyst for the last 12-year 

The following chart illustrates that the US's QE was the catalyst behind driving the stock market since 2008.  QE can make the market rise,  Removing the QE can also make the market fall.  The last QE in 2020 caused the US market to rise more than 100%.


back to top

Why QT now and not later?

Again,  there were no clear answers from Fed.   But it is believed that the Fed must have analysed the set of economic data for various major nations and was of the view that it is the correct time to carry out another QT.  

One main reason why Fed so stubbornly insisted to carry QT may be because the 2 biggest US rivals,  Russia and China,  are now having trouble with their economies.  This has presented a "window" for the US to carry out monetary policies that might affect & downwind the economy.


Will there not be a US Recession in the US?

US might face a recession if the Fed is so stubborn to continue carrying out Quantitation Tightening (QT) indiscriminately,  ignoring the signals of the economy and losing control of the monetary system, thus allowing the US economy to take its "dives down the cliffs".  

If the past US recessions in 2000,  2008, and 2019 can be a guide,  one can be assured if there is a recession it will not be too serious.  Like the recession in 2019,  Fed could always halt the QTs and reintroduce QE again to stimulate the economy.  Fed has enough monetary tools to tame inflation as well as recession


back to top

1)  Rate Hikes & the Market in the 1970s

Someone pointed out the 3 rate Fed fund rate hikes in the '70s.   He suggested that we are now having the first-rate hike. There might be a recession to follow soon after each rate hike.


This chart will show that there were 2 recessions in 1970 and another one in 1973/74.


However,  the situation then was much different from today because the Fed fund rate at that time was higher than 8%.   Also,  if we scrutinize the Fed chart properly,  we would find a recession soon to follow after each rate hike.   This might be because a Fed rate hike will always increase the cost and the burden of doing business. 


Moreover,  there was an energy crisis in the '70s.


back to top

2)  How the Market Responded to Fed's QT (1 July 2022)

Fed said it started to start quantitative tightening (QT) on 1st June,  initially @ USD30 billion per month.    So far,  Fed has not started the QT seriously but the market has already priced in the QT as shown in the attached chart that shows the plot between Fed's Asset vs SP500.


3)  Update about Market Responded to Fed's QT (26 July 2022)

If we add the monetary base to the above chart,  we can see that S&P is more tracking the monetary base (MB) than the Fed's balance sheet.

MB is defined as the total currency which includes other forms of money like M1,  M2, M3 & MZM (MZM is the broadest base money that includes notes and coins).   MB is traditionally the most liquid form of the money supply.


The following chart will tell us that Fed is presently not touching and reducing its balance sheet or the M1, M2 & M3 money supply.  Fed must be reducing only the MZM money supply.  It must be thinking that it can control inflation by just controlling & reducing the supply of MZM.   At the moment,  Fed has discontinued reporting MZM since 2021.   


In conclusion,  we can say that Fed has not actually started to reduce its balance sheet like it did in 2018-2019.  What Fed did was merely reduce the existing money supply to control inflation.
3)  Update:  Market Recovered? ( 26 July 2022)


The market might be serious about a rebound as the Nasdaq 200R has just hit the bottom as shown.   


It might have been anticipated that Fed might stop the QT like it did in 2018/19 as the US's economy is getting weaker with the Consumer Sentiment Index at a new low recently.  


However,  nobody can be certain about what Fed will do next as it might just continue with the QT。  That will "kill" any upcoming rally.   

Presently.  Russia and China are forecasted by IMF to be economically weaker than before as shown in the following chart.  Fed might want to continue with the scheduled QT as it might want to take the opportunity to "destroy" some of the printed money.


References:

1.  3.4 Trillion programs on Mar 15 2020 

https://greenleaftrust.com/news/explaining-3-4-trillion-in-about-1000-words/

2.  6-7 rate hike  not clear about QT on 23 Sept 21

https://sg.news.yahoo.com/fed-fomc-monetary-policy-decision-september-2021-141145429.html#:~:text=The%20Federal%20Reserve%20on%20Wednesday,policies%20in%20a%20few%20years.

3.  Tapering started on 3 November 2021

https://www.cnbc.com/2021/11/03/fed-decision-taper-timetable-as-it-starts-pulling-back-on-pandemic-era-economic-aid-.html

4.  Fed signaled QT plan on 6 April 2022

https://www.washingtonpost.com/business/what-the-feds-quantitative-tightening-plans-mean/2022/04/07/4774f172-b627-11ec-8358-20aa16355fb4_story.html

5.  QT program schedule released on 4 May 2022

https://www.federalreserve.gov/newsevents/pressreleases/monetary20220504b.htm

6.  Biggest rate hike since 2000 - 4 May 2022

https://www.theguardian.com/business/2022/may/04/fed-rate-increase-inflation#:~:text=The%20Federal%20Reserve%20moved%20to,between%200.75%25%20and%201%25.


https://www.reuters.com/business/feds-qt-plan-then-now-2022-04-06/#:~:text=Along%20with%20announcing%20that%20QT,had%20reached%201.00%2D1.25%25.&text=Come%20September%2C%20the%20Fed%20will,and%20%2435%20billion%20of%20MBS.

8.  Outlook of US's economy in 2022 and beyond

https://www2.deloitte.com/us/en/insights/economy/us-economic-forecast/united-states-outlook-analysis.html


Disclaimer:  This article is for information and educational purposes.   Readers are advised to conduct their own research and study to make their own investment decisions.


The Yield Curves Before the Recession

22 May 2022

Search for stock articles in this blog

Investors and stock analysts have always been watching the yield curves carefully,  looking for inverted yield curves in order to foretell the health of the present economy of a country.    This is because it has been proven many times that a country having an inverted yield curve will usually have a recession in the making.   

Examples?

There are 3 occasions in the past 22 years that the US has had its yield curves inverted just before the recession in the years 2001,  2008 and 2019 as shown in the following charts.


The 3 charts are quite similar except the chart for 2019 has had the lowest yield range of less than 3.0%.   This recession in the year 2019 was short and could not have been possible without the 3.4 Trillion stimulus economy rescue package introduced by the US Government in March 2020.  

How does the Yield Curve Look Today?

Presently,  the US's yield curve does not look as perfect and as good as in March 2021 or about 1 year ago.  The present yield curve has an inversion between 20yr and 30yr.  There is also another inversion between 5yr and 10yr.

The present yield curve could have been affected by the Fed's news around September 2021 that it was ramping up Fed Fund rates and carrying out Quantitative Tightening.   In the Fed's plans,  they said the Fed Fund rates will be increased 6 or 7 times and about USD 95 billion per month will be removed from the US's monetary system until further notice.  


How do present Yield Curves compare?

The US's yield curve looks about the same as China's yield curve except the US's yield curve is much flattened above the 2yr.  They are definitely much better than Russia's yield curve which is inverted right now.


One can see from the above chart that the US's yield curve was quite normal about 6 months ago whereas China's yield curve had never changed much.   Russia's yield curve had been inverted.  It looked better about 6 months ago and must have been affected badly by the Ukraine war that started in February 2022. 

Will there Not be a US Recession in the US?

US might face a recession if the Fed is so stubborn to continue carrying out Quantitation Tightening (QT) indiscriminately,  ignoring the signals of the economy and losing control of the monetary system, thus allowing the US economy to take its "dives down the cliffs".  

If the past US recessions in 2000,  2008, and 2019 can be a guide,  one can be assured if there is a recession it will not be too serious.  Like the recession in 2019,  Fed could always halt the QTs and reintroduce QE again to stimulate the economy.  Fed has enough monetary tools to tame inflation as well as recession

Disclaimer:  This article is for information and educational purposes.   Readers are advised to conduct their own research and study to make their own investment decisions.


Wednesday, May 18, 2022

Is this a Bear Market Rally or a Recovery Rally?

Jump to 

 1)  Update: The largest Single-day Fall (19 May 2022)

# largest single-day fall,  bear market rally,  recovery rally,  Dow Jones


18 May 2022

The Dow Jones Industrial Average (DOW) came back and broke the Head and Shoulder line (H&S) last night as shown in the attached chart below.  This has made the market wonder if this is a "bear market rally" or a real market recovery rally.  This article will make an attempt to analyse it.


What  Happened?

The investors were expecting a rally to happen for the following reasons

1.  SP500  was about 19% down from its peak in Jan 2022.  It is expected that investors will make attempt and try their best to avoid SP500 slipping to 20% which will make SP500 officially a bear market.  They made 2 attempts to save Nasdaq from slipping into the bear market at end of April but failed.

2.   The trading calendar was positioned as if with a purpose to "push market sentiments up".  The retail sales estimation figures were in favour and Powell and many money policymakers would speak afterwards;


3.  The market was down for nearly 4 months.  It is about time at least for a temporary rebounce.

However,  although the US market was up last night,  it is expected that the present stock rally is just another bear market rally.


Why?

 1.  The US market was driven by "hope" mainly due to the Quantitative Easing (QE) money although some might not agree.  The SP500 took off soon after Fed pumped in about 3 Trillion in March 2020.  Later,  Fed pumped in another 2 Trillion.


Although the companies have improved their earnings during the period,  it is believed the bulk of these earning increases is spurred by the QEs rather than the market recovery.   Now with the QEs about to be removed in June and the dismaying performance of earning revisions in April,  it is expected that the market will remain under tremendous pressure to improve its earnings & performance going forward.

(doubleclick picture to go the website)


2.  The companies elsewhere are not performing as well as those in the US


3.  China presently has the worse economic report card so far; its dismay performance is likely to throw a spanner into any US recovery attempts.


Chance of Fed Removing or Lighten QT?

Many investors are hoping that Fed would remove or lighten the Quantitative Tightening (QT).  This is especially when Fed ended its first attempt at QT in 2019 earlier than expected because the market was not "gung-ho" about Fed's QT.  

Whether Fed would insist to carry out QT this time in June is not clear but at some point and time,  we know Fed will have to do QT to destroy the "printed money".  This time,  it might be a good window for the Fed to do so because the economy of Russia and China are all in terrible shape.  And a little setback in the US economy might not look too bad or out of tune or out of the order. 

In Conclusion

It is therefore expected that the US and the World market will continue to fall especially when the QT starts as scheduled in June.    The only hope for a market recovery is for Fed to remove or lighten the QT policy but Fed might not want to miss the window to carry out the QT.


back to top

Update:  The Largest Single-day Fall (19 May 2022)

DOW failed to break the Head and Shoulder line (H&S) last night.    This caused DOW to fall more than 1,164 points or 3.57%.  Although it was not the largest single-day fall since the last Great Recession (2008/2009) in terms of percentage,  it was still the largest single-day fall in terms of points.   

On Oct 15, 2008, DOW fell about 724 points or about 7.7% in a single-day.

Going forward,  it is likely to see DOW continues to test the support level @ 31,000.


Not Officially a Bear Market

Although Nasdaq is officially in the Bear Market,  it is not the case for DOW and S&P500.  This is because DOW and S&P500 have never fallen below the 20% from its peak as shown in this chart.   


Search for stock articles in this blog

Disclaimer:  This article is for information and educational purposes.   Readers are advised to conduct their own research and study to make their own investment decisions.

Reference:

Head and Shoulder Pattern

Simple and Easy Way To Backup Photos, Movies and Documents from handphones

 2 December 2023 In the past,  we used iTunes when we wanted to transfer or backup our photos,  movies, and documents from iPhones or Androi...