Search This Blog

Monday, January 28, 2019

Leverage Loan Crisis - The Next Market Crisis?


27 January 2019 (Update)

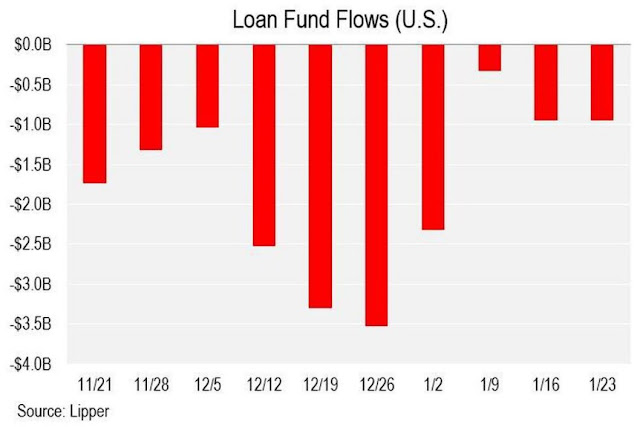
The leverage loan funds continued to bleed in January 2019 after massive loan fund withdrawal at the end of 2018 although the amount of withdrawals were  much lower as shown in the following chart. 


31 December 2018
https://tinyurl.com/ybbyx3gn

What is a Leverage Loan ? 

In layman’s language,  it is a loan extended to Corporations who cannot get proper loans from the banks because they have either bad debts or credit history.  It is a high risk loan that can easily be defaulted and therefore,  lenders always demand a higher interest rate or the loan is leveraged.   In US,  this is a US$1.3 Trillions business which has doubled in the last 5 years.

How Different from Margin Loan?

Margin Loan is also a kind of leveraged loan but it is provided by stock brokers for buying of equity and stock.  It is heavily regulated by the Authorities.  Leverage loan is a presently a private arrangement between the lender and the borrower on agreed terms which are loosely regulated by the Authorities under the “2013 Leveraged Lending Guidance”.  Understand that the authorities were prepared not to enforce the lending guideline due to pressure of deregulation. 

What about Subprime Loans?

Subprime loans  are often refer to loans provided to home owners who have low or poor credit scores. It is also often packaged as "Mortgae-backed Securities (MBS)” and sold to the public.  It was very popular in 2008,  leading to the 2008 credit crisis.   Now some banks or its subsidiaries are providing similar structured loans but for the Corporations with high debts or poor credit ratings. 

What is the Present Situation?

The total leverage loan in the US has grown to US$1.3 Trillions,  much higher than  high yield bond market.  The leverage of such leveraged loans  has climbed to more than 6.5 times in the US.
In  Asia, it is about 4.5 to 5.5 times.   The leveraged loans are climbing back to the level seen in 2006/2007 in Europe and in the US as shown in the following chart.

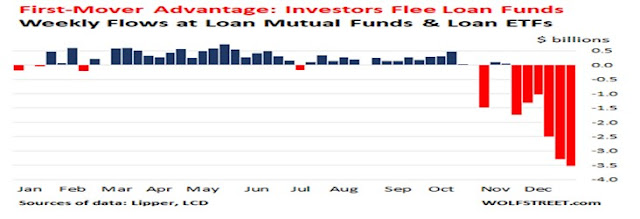
Like Margin Loans,  Leverage Loans are also sensitive to the changes in the market.   In October 2018,   the lenders first seen the returns of leveraged loans declined to negative in the secondary markets..  This could have signaled troubles ahead in the market, causing panic withdrawal of money from Mutual Funds & Loan ETFs in November/December as shown below.  

https://2.bp.blogspot.com/-TLbq00SNCjA/XCl6a-pBwiI/AAAAAAAADvA/9jjEar2abaI6tuPrlXbASe_VunTzKx3RQCLcBGAs/s1600/2018-12-31_10h09_28.jpg

More than US$10 billions of fund were withdrew from the market in the 2 months.  This is almost the whole borrowings of 2018.

Why Leverage Loan Crisis can be Next Market Crisis?

On the record,  the US's leverage loan is only US$1.3 Trillion in total but there was report that   the Corporations have actually owned exorbitant debt to a tune of about US$2.5 Trillions.  This amount is coming close to the $3 Trillion debt that the Subprime Mortgage market peaked and collapsed in 2008.  Just like the subprime mortgage market, these leveraged loans have been packaged as “collateralized loan obligations (CLO)” and sold to “yield-hungry” investors.   Because of this,  many articles have been written about the possibilities of leveraged loans being the next “catalyst” for the coming market crash. 

Can Fed come to the Rescue Again with QE4?

Ms Yellen,  the last Fed Chairperson and IMF’s Christine Lagarde warned about the rampage of Leveraged Loans recently.  Fed also reviewed the “2013 Leveraged Lending Guidance” in May 2018.   Unfortunately,  these efforts did not help to "quench the thirst”  of the market.   The Leverage Loans continues to climb.

However,  it is expected that Fed would not sit around looking helpless this time if there is a similar crisis.  It could have already prepared itself for QE4 to be implemented and ready to “print” money except this time,  instead of buying the “Mortgage-backed Securities (MBS)”, it could be buying or swapping the “Collateralized Loan Obligations (CLO)” from the Banks,  Institution and the big Fund players.    The buying of CLO may be more complex than MBS because the Corporations' assets are not as transparent and simple to deal  as home ownership.   Anyway,  it would appear that Fed’s “balance sheet unwinding”  exercise would  "die of premature death",   paving way for a more serious credit crisis to come in the future. 

Disclaimer:  This article is for information and  educational purposes.   Readers are advised to  conduct their own research and study to make their  own investment decisions.

References
Sunday, January 27, 2019

Has the market really bottomed (2019)?


27 January 2019
https://tinyurl.com/y8uukcsy

The market got off to a great start in January 2019 after the 1,000 point rise in DOW on 26 December 2018.  DOW gained approximately 3,000 points so far,   recovering more than 70% of the 4,000 point drop since 4 December 2008.   Some thought that the worse was almost over;  the market bottomed on 24 December 2018 and  was ready to resume its rally to scale new highs. But,  has the market really bottomed?


Lets examine the question using the following approaches

1.  Market Sentiment Survey
2.  Technical Analyse
3.  Fundamental Discussion
4.  Other Significant Events

1.  Market Sentiment Survey

There was regular survey done by E-Trade Financial on over 200 so called “rich respondents”,  each  managed at least $10,000 of online brokerage account.   According to the survey this month between 2 January and 10 January 2019,  the market sentiment was bearish.  This  bearishness rose 16 percentage points, to 54%.  It was at 3 year high.

However,  sentiment survey is just a survey like this !FFBear index prepared by stockcharts.com as shown in the following chart.  This particular chart is not 100% showing the correct direction the price movement.    This is particularly true if those in the survey or poll are not the 10% “rich investors” who controlled more than 86% of the US market.  Even if the poll is taken from the  “10% rich investors”,  we might also not be able to get the correct picture.  


2  Technical Analysis

Data based on market buying and selling  are more reliable than market survey and polling results.   These data are history records of how investors “put their money in their mouths”.   They are not likely to lie especially over longer period of time and time frames.   One of  such data we can use to tell if the market has really bottomed is “SPXHiLo” Index

What is SPXHiLo Index?

It is one of the indexes also found in stockcharts.com. The SPXHiLo Index is a 10-day moving average of a % ratio taken by dividing the 52-week highs with the sum of 52-week highs plus 52-week lows.   When market is good,  this index will rise; on the contrary,  it will fall.   If the market trend is weak,  this index will make lower lows;  or else,  it will make higher lows.

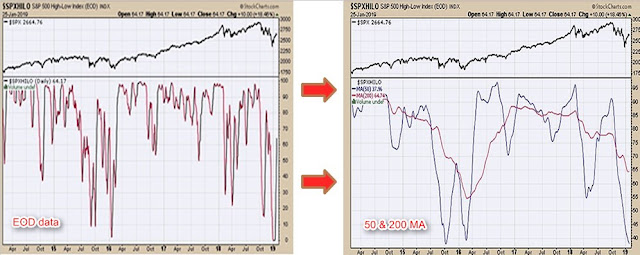
The daily data of SPXHilo is difficult to understand as it rises and falls too quickly.  The data would be more useful and reliable if we are to smoothen it down using moving averages.  The following example makes use of the 50 and 200 moving averages.

https://4.bp.blogspot.com/-6xpLPIbB2jw/XE2kmaUxZ4I/AAAAAAAAD2E/Qe6mYCan2NQHu00SKCmFHw6qqoJKARYZwCLcBGAs/s1600/2019-01-27_08h29_15.jpg

Examples?

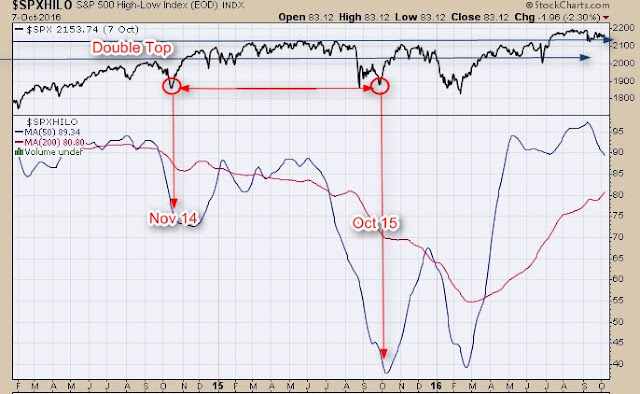
The following chart is showing how SPXHiLo behaved in the period between February 14 and October 16 vs S&P500.  One can see that during the period between Oct 15 and Feb 16,  the 50 MA made 2 equal lows of around 40%.  This is much lower than the low on Nov 14 @ about 73% although S&P500 was at about the same level as the lows at Oct 15 & Feb 16.  This lower low trending shows that S&P500 was very weak then.  Thereafter,  the 50 MA picked  up & crossed over the 200 MA to make new highs,  signalling that S&P500 had recovered.  It became fully recovered when it made higher lows.  Also notice that when SPX broke above the double top formation,   the 50 MA was still at its low, faraway from 200 MA .  This indicates that the rally was a "Head Fake Rally".  It re-visited to test the low around mid-February.

https://3.bp.blogspot.com/-fpkxNqIbyhc/XFZwqdSa6cI/AAAAAAAAD2o/x1eRVcyFF8YfZFEbT2zasUllYZ4PSJAWQCLcBGAs/s1600/2019-01-25_16h32_05.jpg


The following chart is another similar example.  This time,  SPX broke above the double top formation at around Apr 2008 but the 50 MA was quite far down below the 200 MA.  This also indicates the rally @ Apr 2008 was also a  "Head Fake Rally".   
Judging from the very sharp v-shape fall of the 50 MA,  it is believed that many investors were caught holding the stocks then.  They would have to wait until  after March 2009 before they could sell them at a lost.   There was also a "Head Fake Rally" on around Oct 2002 but it occurred when DOW was forming a double bottom.


Now let’s analyse the latest SPXHiLo chart as shown below.   This chart shows that to date,  the 50 MA is far away from the 200MA and is still in sliding down position.  This indicates the present rally is likely to be another “Head Fake Rally” just like the "Head Fake Rally" in 2008 & 2015.  Even if the 50MA can cross the 200MA,  it is likely for DOW to test the lower lows again.


3.  Fundamental Discussions

For the market to recover completely and continue to rally,  there must be some resolutions for the following issues that caused the present market crash.    These issues are:

1.  US Federal Reserve’s interest rate hikes and shrinking of balance sheets;
2.  The Trillion dollar debts that has threatened to damage the Global economy;
3.  The slowing down of Global growth everywhere with housing and retail sale in bad shapes;
4.  The slumping of oil prices and the transportation industries all over the World;
5.  The Trade War between US and China.

Understand that these are thorny issues that cannot get completely resolved.  Even some could be resolved,  they could take many years.  The “mountains’ of debts might not get  eradicated unless there is a war or bankruptcy proceedings to “wipe” the debts out completely. 

Other Significant Events

Other significant events and happenings that can easily derail the present rally include the following:

1.  Record Hedge Fund Liquidation 

Last year,  the US Hedge Fund industry set new record in liquidation.     Hedge Fund Research reported that  344 Hedge Funds closed their doors during 3rd Quarter 2018.  This is about 30% more than the record of 267 set in 4th Quarter of 2006.   On an annualized basis, the 2018 figure of  920 Hedge Fund liquidations is about 9% more than the 2005 record of 848.   It is therefore unlikely that the market has completely recovered from the recent stock market fall and declared that the market has bottomed on 24 December 2018,  

2.  Record Margin Debt Recalls 

The last market crash in December 2018 has triggered the explosive decline in Margin Loans There must be margin calls then resulting the margin loan market to lose another USD$38 billions in December 2018,  threatening to break the record set in 2008.

 3.  Countries in Negative Growth List

10 countries joined the list to become "countries with negative growth" in the month of Sept 2018.  Among them,  5 of them already in technical recession. They include Italy and Agentina, 

https://1.bp.blogspot.com/-sxIZ4cXEQz0/XFfBEJIHtDI/AAAAAAAAD3U/QPHfLystYdQVi5bfBIkWws4GRC0BKHIngCLcBGAs/s640/2019-02-04_12h13_36.jpg

What to Do Next?
 
The market is presently in the hand of a few “riches” that controlled more than 85% of the market.  They are playing the games among  themselves and call the “shots” when they like it.  As a retail investor,  we could be “coiled” around by them if we were to play against them even though we knew their movements and can bet what would be their next move using chart and technical analysis; but,   these are tools that may be completely useless against market manipulations.  

Fortunately,  it was always said that market manipulations affect mostly the day traders and short term players.  Staying as a long term investor and not to jump into any conclusion about market recovery is the best move so far under the present environment.

Disclaimer:  This article is for information and  educational purposes.   Readers are advised to  conduct their own research and study to make their  own investment decisions.


Saturday, January 26, 2019

Fake or Real Stock Rally?


26 January 2019
https://tinyurl.com/ybmwdlty

All US stock indexes rallied on 26 December and broke the Double Top’s  resistance within a few days after hitting a level that appears to be the support on 24 December 2018.  For DOW,   the stock rose to 24,737 to touch 73% of the drop @ 25,813 on 3rd December 2018 as shown in the attached.  This 73% is more than 61.8% Fibonacci,  which is a level that many Analysis referred to a level of stock recovery.


However,  if one is observant,  DOW did not have the trading volume when it broke the double top’s resistance line.  To many Technical Analysts,  the double top resistance might  be a “fake” resistance.   However,  if one were to check again,  one would notice immediately volume has surged tremendously when it broke the resistance;  therefore,  it is a not a “fake” resistance but rather,   it might be a “Head Fake Rally” instead.   

“Head Fake Rally (HFR)”?

HFR is actually a “bull trap” rally.   It is a term used  to describe sudden turn in market direction especially when the price has broken or tired to break a resistance,  “tricking” the bulls to buy the stocks.   It is very common to find this kind of "bull trap" rallies in a manipulated stock market.

Examples?

In 2018,  there are 2 such occasions where HFR  were found.  This is on 8 November and on 3 December when DOW hit the 50 MA resistance.   This HFR is about to be formed in the recent rally as shown in the following chart. 

On both occasions on 8 November and 3 December 2018,  DOW broke the 50 MA but the rally failed and went straight down to hit lower lows.   The same kind of HFR were also found in 2016 and 2008 as shown in the following charts.


In the above chart,  DOW tried and failed to break above 200 MA.


The above chart shows again that DOW failed to break above the 50 MA or 200 MA and went straight down to test lower lows.   There must be plenty of other such examples that one could also find in other time periods.

Has the Market Really Hit the Bottom?

This must be a million dollar question that many would want an answer.   But this answer will not come until DOW has tested the low or clear the peak.  This topic is discussed here.

Disclaimer:  This article is for information and  educational purposes.   Readers are advised to  conduct their own research and study to make their  own investment decisions.

Thursday, January 24, 2019

What’s Wrong with the Present Market Recovery?


23 January 2019
tinyurl :https://tinyurl.com/yddjqq9n

S&P recovered about 72% from the drop on 3 December or about 55% from the drop on 20 Sept when the peak was 2930. 


Shortest Recovery Time in History

The recovery this time  took 17 days  if we were to consider the 61.8% Fibonacci rise from the bottom as the level of  recovery. This would be the shortest recovery time in history.

Peak
Trough
Peak Price
Trough Price
% loss
Days to Recovery
7/09/29
13/11/29
31.92
17.66
-44.7
67
10/04/30
1/06/32
25.92
4.4
-83
783
7/09/32
27/02/33
9.31
5.53
-40.6
173
18/07/33
21/10/33
12.2
8.57
-29.8
95
6/02/34
14/03/35
11.82
8.06
-31.8
401
6/03/37
31/03/38
18.68
8.5
-54.5
390
9/11/38
8/04/39
13.79
10.18
-26.2
150
25/10/39
10/06/40
13.21
8.99
-31.9
229
9/11/40
28/04/42
11.4
7.47
-34.5
535
29/05/46
9/10/46
19.25
14.12
-26.6
133
15/06/48
13/06/49
17.06
13.55
-20.6
363
15/07/57
22/10/57
49.13
38.98
-20.7
99
12/12/61
26/06/62
72.64
52.32
-28
196
9/02/66
7/10/66
94.06
73.2
-22.2
240
29/11/68
26/05/70
108.37
69.29
-36.1
543
11/01/73
3/10/74
120.24
62.28
-48.2
630
28/11/80
12/08/82
140.52
102.42
-27.1
622
25/08/87
4/12/87
336.77
223.92
-33.5
101
24/03/00
9/10/02
1527.46
776.76
-49.1
929
9/10/07
9/03/09
1565.15
676.53
-56.8
517
20/09/18
24/12/18
2930
2351
-24.6
17


In Feb last year after DOW made history by dropping 660 point and recovered the next few day,  many Analysts came out weeks later to say Most political has no impact to stock market” Or just simply giving a remark about “how quick we fall and how fast we will recover”

Why Market Can Recover So Fast?

The following are the likely reasons:-

a)  The US economy was great as Trump had claimed or
b)  The US economy will be soon recovered because the Corporate Earning are still good or
c)  The present recovery is manipulated or
d)  Other reasons  

Everyone knows that the Global economy is not as good as debts are piling up like no tomorrow.   People are living now with borrowed money and at the same time,  the household debts in many countries have risen higher and higher year by year.  

At the Corporate level,  things aren’t  looking any better.  Corporate earnings are getting worse than before as shown in the following pictures.   


Although the Corporates are better off after Trump introduced tax reform in 4Q17,  the effect appears to have worn out quickly after about one year.


Many Analysts said that the Corporate earnings are not necessary the important factor for  charting stock market direction. "Poor earnings may not stop a market rally", said JP Morgan.     They also argued that the stock market is not the economy and a strong economy can drive the stock market price lower than expected.  

A more pragmatic  Jim Creamer said that “Four things need to happen for the stock market to bottom and recover".   Unless there are resolutions in  “Federal Reserve, oil prices, the transportation industry and the trade war with China”.   the present market might not have fully recovered.

The Present Recovery is Manipulated

Our present stock market is not the same old market we used to see before year 2000.  The market has changed from a transparent, fair, and efficient manner to a non-transparent,  new  mode of market where a handful of  people, sitting behind the machines, can manipulate the market in which millions of dollars can just vanished in seconds. 

It was also said in 2016 that the Richest 10% of Americans Now Own 84% of All Stocks. Today,    this figure must  have risen to more than to 86%. 

The numbers of Adult Invested in Stock has dropped to 52% with stock trading volume much reduced but the price kept going up by almost 100%.  This illustrates clearly that the few traders left in the markets are playing against themselves,  pushing the price up with little or no trading activities.

The present stock market is almost sharing  the same true story about how the World's "Copper King,  Yasuo Hamanaka",  controlled the copper market in the 1990s.


What we should do next?

There is no way we can control or change how the big boys play the game.   The best way is to accept that manipulation is a part of market structure.

Fortunately,  stock manipulation affects more the day traders and those short term investors rather than the long term investor who holds stocks over long period of time.  At times,   it may even benefit long term investors as they can take opportunities to buy stocks at low and sell them at high.  

As the present market is suspected to be heavily manipulated by a few hands,  it is best to proceed  cautiously and not to assume the market has truly bottomed and recovered from its price correction.

Disclaimer:  This article is for information and  educational purposes.   Readers are advised to  conduct their own research and study to make their  own investment decisions.

Simple and Easy Way To Backup Photos, Movies and Documents from handphones

 2 December 2023 In the past,  we used iTunes when we wanted to transfer or backup our photos,  movies, and documents from iPhones or Androi...