Search This Blog

Sunday, August 21, 2022

US Stock Movements

Jump to

23 Aug 2022  20 Aug 2022


back to top

23 August 2022

DOW started its descent with a "bang" of more than 600 points yesterday after breaking the red trendline. It has also broken the Support1 which was not marked earlier.  In addition,  it has created a new candlestick Gap3 as shown.  

With the creation of Gap3,  the following options become available:

1.  Cover up Gap 3 immediately;

2.  Cover up Gap 1 before covering Gap 3;

3.  Proceed to cover up Gap1, and test the other supports to cover Gap2 before coming back up to cover Gap 3;.

From the observations of the other trending charts,  it would appear that the traders were creating Gap3 for the purpose of returning back after having covered Gap2. Also, if they wanted to cover Gap3,  they would have already done so during the trading session.  

The observations also support option 3 to be a likely trading option at the moment unless another incident like the "2008 Lehman Brothers" event were to happen again.


back to top

20 August 2022

The US stock has reached the overbought region and is ready to make a descent.  The descent will start as soon as DOW breaks the red trend line as shown.   Thereafter, it will try to cover gap 1 and test the support @32,387 as shown.  


Saturday, August 20, 2022

How Best to tell if Market has really Bottomed?

18 August 2022


Jump to 


This is presently the most pressing question that many would want an answer to.  Some chartists speculated that the present US market trend is just like in 2008 when the market is expected to undergo another downtrend or drop before it can recover.  

Some went as far back to draw charts and superimpose the charts of 1937,  2000, 2008, and 2022 to prove their points.  This article will show how the market has really bottomed and if we should enter the market now.


When will Market Bottom?

The market often considered to have bottomed when there are more than 80% of the stocks hit their 200MA as predicted earlier on 26 July 2022


What if This Happens Again?

The market may cause a secondary bottom and collapse again like it had happened on September 15,  2008, when Lehman Brothers went bankrupt.  On that very day,  the Dow Jones Industrial Average had lost 4.5%,  the largest since the  911 Terrorist attack on the Twin Towers in New York on September 11, 2001. 


How to Tell if such a thing will happen again?

To know how to tell, please click the "Reveal" button to see the next chart. 


This chart shows that there were 2 events that caused the market failures and did not recover after the market stock hit the 200MA baseline. These 2 events are: 
  
a)  Lehman Brother Event (Marked Event 1 in the Chart)

Before the Lehman Brothers event,  the market was running on another track in 2007 as shown.  The stocks hit the 200MA around March 2008 & recovered.  When Lehman Brothers declared bankruptcy on September 15, 2008,  the market hit the 200MA again.  This time,  it went really down under, changing also its course to run on a new track as shown.

b)  The Covid 19 (Marked Event 2  in the chart)

This event started by Fed's QT in 2018/19.  The market recovered after stocks hit the 200MA in 2019 but it was soon spooked by the Covid19 break out in China.   The secondary bottom appeared only after the US Government started up the 3 Trillion USD Covid Stimulus packages in March 2020.


In Conclusion

If there is a similar happening like Lehman Brothers appears this time,  it is likely to do exactly the same.  It will run down and break the red trend line as shown before recovering.  It might also run on an entirely different track like 2008/09 if the secondary bottom were to be as bad as the Lehman Brothers event.


Disclaimer:  This article is for information and educational purposes.   Readers are advised to conduct their own research and study to make their own investment decisions. 


Sunday, August 14, 2022

The Labour Force Participation Rate (LFPR) as Stock Indicator

14 August 2022

The labor force is important in any economy.  An increasing labor force indicates healthy economic growth.    The scale of labor supply in a country is often measured by the labor force participation rate (LFPR). Therefore,  the higher the LFPR,  the better and healthier will be the economy and vice versa.  Investors often use LFPR to judge an economy before laying out their investment plans.

Examples 

Germany

Germany has been regarded as one country that has a better and healthier economy not only in Euro Area but also in the World.  In the past 20 years,  Germany's participation rate has risen steadily from about 70% to the present 80%.  It has managed to maintain positive GDP growth every year except for 5 occasions marked as shown in the attached chart.


Other Countries

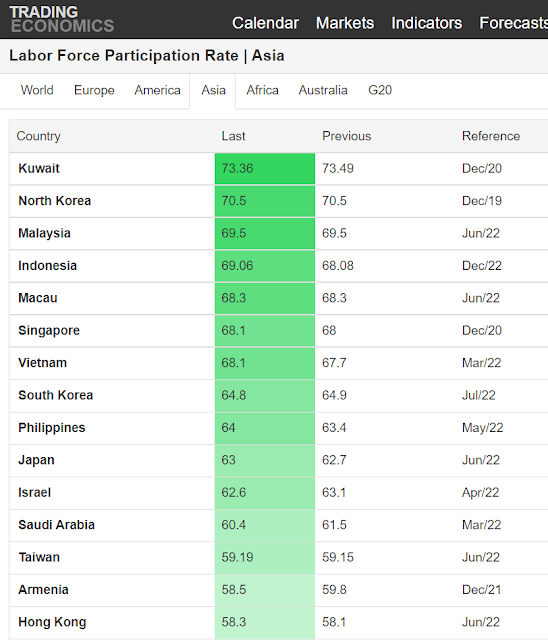
The following chart shows the labor force participation rate as listed in the World Bank's record.

G20 Countries


Asian Countries


Where to get the Data

The Best Places

2.   World Bank
3  CEIC *

* likely to be using models to project/estimate when National figures are not available

Why China is not included?

For some reason,  China stopped reporting its National LFPR in 2016 as shown in this World Bank Chart. 
DoubleClick picture to visit the webpage


One could only read from the model that predicts and projects the latest figure.  The last projected figure is 68%.
DoubleClick picture to visit the webpage

Why has China Stopped Reporting Since 2016?

China suffered the weakest annual growth in 26 years in 2016 when it reported a GDP growth rate of 6.7% , down from 6.9 % in 2015.  There was a job loss of about 1% in that year according to this chart from Moody's Analytics. Since then,  China had not been reporting good labor force statistics.  It is not known if this is the real reason.

DoubleClick picture to visit the webpage


The Younger Labor Force

The younger labor force participation is often regarded also as an important statistic to judge the health of an economy.   The following World Bank chart shows that China has stopped reporting such statistics since 2010.  Most economies have reported lower LFPR after the pandemic in 2020. 

DoubleClick picture to visit the webpage

The LFPR & Stock Market

The LFPR might not be the best indicator to track the movement of the stock market but it can be used to predict if there will be a large market movement as shown in this chart.  The better indicator to track the stock market is the payroll figure at the moment

As of 14 August 2022,  the chart is showing a very healthy LFPR for the US labor market.  If not because of the pending Fed's QT  in session,  the US stock market could have recovered and taken off to make new highs.


Real Time LFPR& Stock Chart

source: tradingeconomics.com


Conclusion

Labor force participation rate (LFPR) has always been used by analysts all over the World to judge the strength of an economy.  A rising economy would have a rising LFPR.  Of late,  many economies are suffering from declining LFPR particularly in the age between 15-24,  the younger labor force.   China has purposely chosen not to report the LFPR since 2016.  However,  many analysts still use models to estimate and project this LFPR from China.

Disclaimer:  This article is for information and educational purposes.   Readers are advised to conduct their own research and study to make their own investment decisions.

Simple and Easy Way To Backup Photos, Movies and Documents from handphones

 2 December 2023 In the past,  we used iTunes when we wanted to transfer or backup our photos,  movies, and documents from iPhones or Androi...