Search This Blog

Monday, May 23, 2022

The Rate Hike and Quantitative Tightening

20 May 2022

Jump to 

 1)  Why QT Now & Not Later
 2)  Rate Hikes & the Market in the 1970s
 3)  How Market Responded to QT (1 July 2022)
 4)  Update: Market Responded to QT (26 July 2022)
 5)  Update: Market Recovered? (26 July 2022)

Search for stock articles in this blog

The US stock market is very sensitive to the news and announcements about  U.S. Federal Reserve (Fed)'s monetary policies,  be it Fed Fund rate hikes or cuts or quantitative easing (QE) or tightening (QT).  The stock market price will go up when there are rate cuts or QEs and vice versa.  

This time around, Fed announced it will increase the Fed Fund rate hikes 6 or 7 times until the inflation is tamed.  It will also carry out the QT at an increasing pace.  Fed had carried out similar rate hikes and QT also in 2015 except this time around,  the global economy is not looking as good. 

This article will try to discuss how this round of monetary policies will affect the US as well as the stock market.

What happened?

Prior to 2020,  the stock markets had their glorious days.  These all came to an end when Covid broke up the pace in early 2020.  The US has the highest Covid infection rate and many people died.  The global economy took a tumble with many countries having negative GDP growth in the 1st quarter of 2020.    

On March 15, 2020,  the US Government took the initiative to pump over USD$700 billion into the US monetary system to rescue the economy.  Later in the year,  it made available USD2.3 Trillion for the lending program and expand the QE program with USD3.4 Trillion money for an unlimited period.    

This 3.4 Trillion stimulus package of 2020 set the stock market on a rally; unfortunately, it also caused the US's inflation rate to rise quickly from an average of about 2.5% in 2020 to the present 8.5% in 2022.  

To curb the rising inflation,  Fed announced in September 2021 that it would raise the Fed Fund rate 6 or 7 times in a controlled manner.  At about the same time,  Fed also announced that it would reduce the QEs/  In May 2022,  the Fed came up with a QT plan indicating that it would reduce the size of its balance sheet by up to USD$ 95 billion per month until further notice. 

The following is the table showing the detail of the rate hikes and QE/QT plans carried out or to be carried out in 2020/22.

How the Stock Market Reacted?

These Fed's rate hikes and QT plans put the "nails" on the US stock market's "coffin", sending the US stock market tumbling an average of more than 15% to date as shown in the following chart.

Why was the US's Inflation rate Rising?

It is known that printing money indiscriminately for citizens to spend will cause the inflation rate to rise.  For years since 2008,   the US Fed has been said to "Print" a lot of money under its QE programs but these QEs are for lending programs and they have never caused the US inflation rate to rise.  The last QE of USD3.4 Trillion in 2020 was given out for the US people to spend to tie over the Covid pandemic.  This last QE raised the US's inflation rate from an average of 2.5 in 2020 to about 8.5% in 2022 as shown in the following chart.  


How Stock Market Reacted to Rate Hikes?

It was the conventional belief that Fed rate hikes will increase business capital costs and will affect the economy and slump the stock market.  However,  this was never the case in the past years when the borrowing cost was low & the economy was growing as shown in this chart. 

Later,  on 3 November 2021,  Fed announced that it would taper and cut the size of its balance sheet through QT,  This announcement set the stock market tumbling.  

Why the Tapering and QT?

If rate hikes can curb the rise in the inflation rate,  why the need to do monetary tapering and QT?   

There were no clear answers from Fed.  Maybe the QE was never intended to be part of the permanent monetary system when the last Fed Chairman,  Mr Bernake,  introduced it in 2008/09.  It was meant to be a temporary measure to rescue the failing economy during the "Great Recession" in 2008/09.  It was supposed to be removed later and the money to be destroyed when the economy recovers.   

When was the last QT?

Fed had planned to start QT in 2018 when it was thought to be the right time.  The market sentiment was good and the US's economy was on the rise.  But Fed removed the QT program in 2019 as it sensed an economic downturn caused by Covid that was spreading quickly in China.   


QE,  the Catalyst for the last 12-year 

The following chart illustrates that the US's QE was the catalyst behind driving the stock market since 2008.  QE can make the market rise,  Removing the QE can also make the market fall.  The last QE in 2020 caused the US market to rise more than 100%.


back to top

Why QT now and not later?

Again,  there were no clear answers from Fed.   But it is believed that the Fed must have analysed the set of economic data for various major nations and was of the view that it is the correct time to carry out another QT.  

One main reason why Fed so stubbornly insisted to carry QT may be because the 2 biggest US rivals,  Russia and China,  are now having trouble with their economies.  This has presented a "window" for the US to carry out monetary policies that might affect & downwind the economy.


Will there not be a US Recession in the US?

US might face a recession if the Fed is so stubborn to continue carrying out Quantitation Tightening (QT) indiscriminately,  ignoring the signals of the economy and losing control of the monetary system, thus allowing the US economy to take its "dives down the cliffs".  

If the past US recessions in 2000,  2008, and 2019 can be a guide,  one can be assured if there is a recession it will not be too serious.  Like the recession in 2019,  Fed could always halt the QTs and reintroduce QE again to stimulate the economy.  Fed has enough monetary tools to tame inflation as well as recession


back to top

1)  Rate Hikes & the Market in the 1970s

Someone pointed out the 3 rate Fed fund rate hikes in the '70s.   He suggested that we are now having the first-rate hike. There might be a recession to follow soon after each rate hike.


This chart will show that there were 2 recessions in 1970 and another one in 1973/74.


However,  the situation then was much different from today because the Fed fund rate at that time was higher than 8%.   Also,  if we scrutinize the Fed chart properly,  we would find a recession soon to follow after each rate hike.   This might be because a Fed rate hike will always increase the cost and the burden of doing business. 


Moreover,  there was an energy crisis in the '70s.


back to top

2)  How the Market Responded to Fed's QT (1 July 2022)

Fed said it started to start quantitative tightening (QT) on 1st June,  initially @ USD30 billion per month.    So far,  Fed has not started the QT seriously but the market has already priced in the QT as shown in the attached chart that shows the plot between Fed's Asset vs SP500.


3)  Update about Market Responded to Fed's QT (26 July 2022)

If we add the monetary base to the above chart,  we can see that S&P is more tracking the monetary base (MB) than the Fed's balance sheet.

MB is defined as the total currency which includes other forms of money like M1,  M2, M3 & MZM (MZM is the broadest base money that includes notes and coins).   MB is traditionally the most liquid form of the money supply.


The following chart will tell us that Fed is presently not touching and reducing its balance sheet or the M1, M2 & M3 money supply.  Fed must be reducing only the MZM money supply.  It must be thinking that it can control inflation by just controlling & reducing the supply of MZM.   At the moment,  Fed has discontinued reporting MZM since 2021.   


In conclusion,  we can say that Fed has not actually started to reduce its balance sheet like it did in 2018-2019.  What Fed did was merely reduce the existing money supply to control inflation.
3)  Update:  Market Recovered? ( 26 July 2022)


The market might be serious about a rebound as the Nasdaq 200R has just hit the bottom as shown.   


It might have been anticipated that Fed might stop the QT like it did in 2018/19 as the US's economy is getting weaker with the Consumer Sentiment Index at a new low recently.  


However,  nobody can be certain about what Fed will do next as it might just continue with the QT。  That will "kill" any upcoming rally.   

Presently.  Russia and China are forecasted by IMF to be economically weaker than before as shown in the following chart.  Fed might want to continue with the scheduled QT as it might want to take the opportunity to "destroy" some of the printed money.


References:

1.  3.4 Trillion programs on Mar 15 2020 

https://greenleaftrust.com/news/explaining-3-4-trillion-in-about-1000-words/

2.  6-7 rate hike  not clear about QT on 23 Sept 21

https://sg.news.yahoo.com/fed-fomc-monetary-policy-decision-september-2021-141145429.html#:~:text=The%20Federal%20Reserve%20on%20Wednesday,policies%20in%20a%20few%20years.

3.  Tapering started on 3 November 2021

https://www.cnbc.com/2021/11/03/fed-decision-taper-timetable-as-it-starts-pulling-back-on-pandemic-era-economic-aid-.html

4.  Fed signaled QT plan on 6 April 2022

https://www.washingtonpost.com/business/what-the-feds-quantitative-tightening-plans-mean/2022/04/07/4774f172-b627-11ec-8358-20aa16355fb4_story.html

5.  QT program schedule released on 4 May 2022

https://www.federalreserve.gov/newsevents/pressreleases/monetary20220504b.htm

6.  Biggest rate hike since 2000 - 4 May 2022

https://www.theguardian.com/business/2022/may/04/fed-rate-increase-inflation#:~:text=The%20Federal%20Reserve%20moved%20to,between%200.75%25%20and%201%25.


https://www.reuters.com/business/feds-qt-plan-then-now-2022-04-06/#:~:text=Along%20with%20announcing%20that%20QT,had%20reached%201.00%2D1.25%25.&text=Come%20September%2C%20the%20Fed%20will,and%20%2435%20billion%20of%20MBS.

8.  Outlook of US's economy in 2022 and beyond

https://www2.deloitte.com/us/en/insights/economy/us-economic-forecast/united-states-outlook-analysis.html


Disclaimer:  This article is for information and educational purposes.   Readers are advised to conduct their own research and study to make their own investment decisions.


The Yield Curves Before the Recession

22 May 2022

Search for stock articles in this blog

Investors and stock analysts have always been watching the yield curves carefully,  looking for inverted yield curves in order to foretell the health of the present economy of a country.    This is because it has been proven many times that a country having an inverted yield curve will usually have a recession in the making.   

Examples?

There are 3 occasions in the past 22 years that the US has had its yield curves inverted just before the recession in the years 2001,  2008 and 2019 as shown in the following charts.


The 3 charts are quite similar except the chart for 2019 has had the lowest yield range of less than 3.0%.   This recession in the year 2019 was short and could not have been possible without the 3.4 Trillion stimulus economy rescue package introduced by the US Government in March 2020.  

How does the Yield Curve Look Today?

Presently,  the US's yield curve does not look as perfect and as good as in March 2021 or about 1 year ago.  The present yield curve has an inversion between 20yr and 30yr.  There is also another inversion between 5yr and 10yr.

The present yield curve could have been affected by the Fed's news around September 2021 that it was ramping up Fed Fund rates and carrying out Quantitative Tightening.   In the Fed's plans,  they said the Fed Fund rates will be increased 6 or 7 times and about USD 95 billion per month will be removed from the US's monetary system until further notice.  


How do present Yield Curves compare?

The US's yield curve looks about the same as China's yield curve except the US's yield curve is much flattened above the 2yr.  They are definitely much better than Russia's yield curve which is inverted right now.


One can see from the above chart that the US's yield curve was quite normal about 6 months ago whereas China's yield curve had never changed much.   Russia's yield curve had been inverted.  It looked better about 6 months ago and must have been affected badly by the Ukraine war that started in February 2022. 

Will there Not be a US Recession in the US?

US might face a recession if the Fed is so stubborn to continue carrying out Quantitation Tightening (QT) indiscriminately,  ignoring the signals of the economy and losing control of the monetary system, thus allowing the US economy to take its "dives down the cliffs".  

If the past US recessions in 2000,  2008, and 2019 can be a guide,  one can be assured if there is a recession it will not be too serious.  Like the recession in 2019,  Fed could always halt the QTs and reintroduce QE again to stimulate the economy.  Fed has enough monetary tools to tame inflation as well as recession

Disclaimer:  This article is for information and educational purposes.   Readers are advised to conduct their own research and study to make their own investment decisions.


Wednesday, May 18, 2022

Is this a Bear Market Rally or a Recovery Rally?

Jump to 

 1)  Update: The largest Single-day Fall (19 May 2022)

# largest single-day fall,  bear market rally,  recovery rally,  Dow Jones


18 May 2022

The Dow Jones Industrial Average (DOW) came back and broke the Head and Shoulder line (H&S) last night as shown in the attached chart below.  This has made the market wonder if this is a "bear market rally" or a real market recovery rally.  This article will make an attempt to analyse it.


What  Happened?

The investors were expecting a rally to happen for the following reasons

1.  SP500  was about 19% down from its peak in Jan 2022.  It is expected that investors will make attempt and try their best to avoid SP500 slipping to 20% which will make SP500 officially a bear market.  They made 2 attempts to save Nasdaq from slipping into the bear market at end of April but failed.

2.   The trading calendar was positioned as if with a purpose to "push market sentiments up".  The retail sales estimation figures were in favour and Powell and many money policymakers would speak afterwards;


3.  The market was down for nearly 4 months.  It is about time at least for a temporary rebounce.

However,  although the US market was up last night,  it is expected that the present stock rally is just another bear market rally.


Why?

 1.  The US market was driven by "hope" mainly due to the Quantitative Easing (QE) money although some might not agree.  The SP500 took off soon after Fed pumped in about 3 Trillion in March 2020.  Later,  Fed pumped in another 2 Trillion.


Although the companies have improved their earnings during the period,  it is believed the bulk of these earning increases is spurred by the QEs rather than the market recovery.   Now with the QEs about to be removed in June and the dismaying performance of earning revisions in April,  it is expected that the market will remain under tremendous pressure to improve its earnings & performance going forward.

(doubleclick picture to go the website)


2.  The companies elsewhere are not performing as well as those in the US


3.  China presently has the worse economic report card so far; its dismay performance is likely to throw a spanner into any US recovery attempts.


Chance of Fed Removing or Lighten QT?

Many investors are hoping that Fed would remove or lighten the Quantitative Tightening (QT).  This is especially when Fed ended its first attempt at QT in 2019 earlier than expected because the market was not "gung-ho" about Fed's QT.  

Whether Fed would insist to carry out QT this time in June is not clear but at some point and time,  we know Fed will have to do QT to destroy the "printed money".  This time,  it might be a good window for the Fed to do so because the economy of Russia and China are all in terrible shape.  And a little setback in the US economy might not look too bad or out of tune or out of the order. 

In Conclusion

It is therefore expected that the US and the World market will continue to fall especially when the QT starts as scheduled in June.    The only hope for a market recovery is for Fed to remove or lighten the QT policy but Fed might not want to miss the window to carry out the QT.


back to top

Update:  The Largest Single-day Fall (19 May 2022)

DOW failed to break the Head and Shoulder line (H&S) last night.    This caused DOW to fall more than 1,164 points or 3.57%.  Although it was not the largest single-day fall since the last Great Recession (2008/2009) in terms of percentage,  it was still the largest single-day fall in terms of points.   

On Oct 15, 2008, DOW fell about 724 points or about 7.7% in a single-day.

Going forward,  it is likely to see DOW continues to test the support level @ 31,000.


Not Officially a Bear Market

Although Nasdaq is officially in the Bear Market,  it is not the case for DOW and S&P500.  This is because DOW and S&P500 have never fallen below the 20% from its peak as shown in this chart.   


Search for stock articles in this blog

Disclaimer:  This article is for information and educational purposes.   Readers are advised to conduct their own research and study to make their own investment decisions.

Reference:

Head and Shoulder Pattern

Saturday, April 23, 2022

Only Shanghai had Surplus Among 31 Provinces in 1st Half 2021

23 April 2022

Jump to 

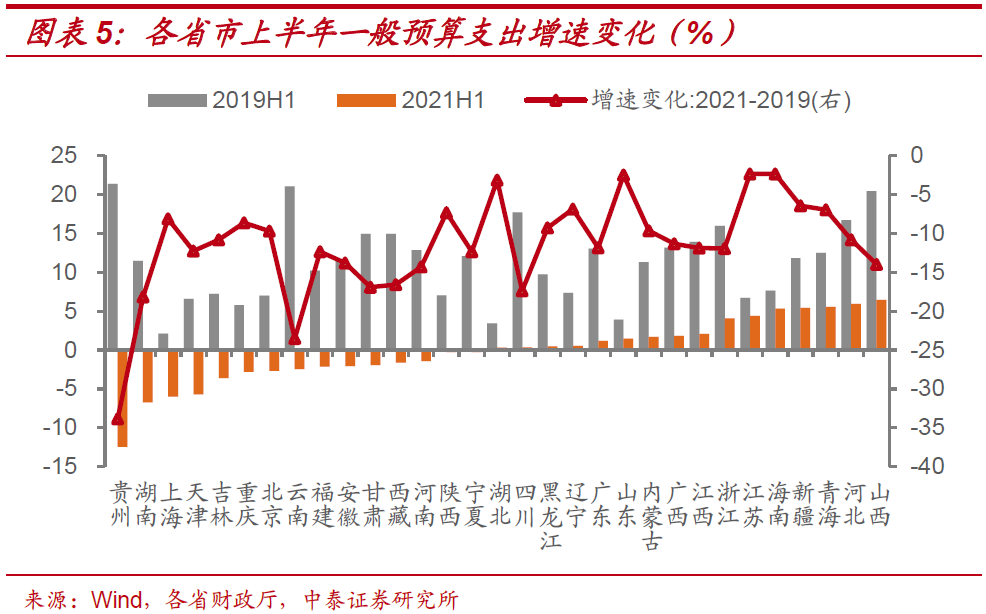
In the first half of 2021, Shanghai was the only province that had a "surplus" of about 94.26 billion yuan in revenue collection.  The rest of the 30 provinces in China were in financial debt.  This is a clear contract to the year 2017 when 6 provinces,  namely,   Guangdong, Jiangsu, Zhejiang, Fujian, Beijing and Shanghai had a surplus. 

Doubleclick to visit the webpage


The deficit was recorded despite the various efforts made by various Provincial Governments to cut down their expenditure as shown in this chart

The above 2 charts clearly express that China's economy is unlike before. They are now facing an economic downturn.  Many Provincial Governments are not self-sufficient,  requiring financial assistance from the Central Government.


Reasons?

Most Chinese Analysts avoided giving any reason for the revenue deficit choked up by various Provincial Governments.  But some trying to explain that the occurrence of this deficit is quite common.  They explained that this is a natural occurrence when there were policy changes in the deployment of funds by the Central Government.

However,  we are all aware of the following events which have taken place and were ongoing during these difficult periods:-

a)  Covid Shutdowns and Control Measures

The zero Covid policy brings about frequent shutdowns in various cities and rural towns and counties in order to control the Covid Spread. Someone estimated that this has cost China some $45 billion per month or about 3% of China's GDP;

b)  Power Failure and Electricity Load Shedding  

The country suffered a country-wide power failure and load shedding after they banned the import of Australian coal end of 2020.  Without allowing the power generating companies to increase the electricity tariff to cover up additional expenditure of importing the more expensive coal from other countries,  the generating companies resorted to cutting down generation capacity causing country-wide power load shedding.  These frequent power failures and load shedding must have hit many industries badly.

c)  The US-China Trade War

The US-China Trade War started around 2018 and continued into 2021 has caused many foreign companies to pull their manufacturing facilities out of China.  Such mass exits have caused many to lose their jobs and earning power,  reducing the Provincial Government's revenue;

d)  The Xinjiang Cotton Controversy 

Although the Xingjiang Cotton Controversy was known to the public around March 2021,  the event took place about a year ago in March 2020 when BCI, the Better Cotton Initiative took the initiative to suspend the licensing and assurance activities in Xinjiang.  This action by BCI could have caused many jobs in Xinjiang as well in other parts of China.


back to top

Update: 16 August 2022

The financial condition of China has deteriorated further in 1st half of 2022.  This time,  all 31 provinces and cities in the mainland were unable to make ends meet.   Guangdong, Henan, and Sichuan are the most serious with Sichuan rumored to be the worse for many years to come. 

Henan had bank runs in some local banks.  

Shanghai, Tianjin, and Hainan which used to be better provinces with higher revenues are now in the red. 

The financial situation of the 31 provinces is worsening as shown in the following table.

Monday, March 28, 2022

How Badly Will the World's Energy Supplies Be Affected by the Ukraine War?

It has been told many times by some that the World will be in trouble if they continued to oppose Russia in trying to take over Ukraine.   The Russian leaders have been quoted to say that Russia was only trying to solve a "domestic problem" in Ukraine.  Putin even called this  Ukraine military action a "special military exercise."  

Voices are heard everywhere, threatening those "unfriendly nations" who recently sanctioned Russia that they will get the worse when Putin asked them to pay their natural gas bill in "Roubles" instead of the Euros or US dollars.  

It is not the intention of this article to find out if such voices are correct or the unfriendly nations will get into real trouble.  It intends to present a correct picture to the reader for them to judge for themselves if such threats are real.

The Supplies from Russia

Russia is a country blessed with a lot of minerals and supplies that the World needs.   Natural Gas is one of them. Countries near Russia,  such as Poland,  Germany,  China are not only getting natural gas in LNG tanks but also piped gas through long pipelines all the way from remote Russian areas such as Sibireas.  Over 70% of the country's reserves are currently held by Gazprom, a Russian state-owned company.


How much Natural Gas is from Russia?

One can find this information from a lot of sources.  The ones shown here are from Worldometer.  The following picture shows the yearly natural gas production (in MMCF) of the 10 largest gas producers of the World.

a)  In numbers

<Doubleclick picture to go to the original webpage>


b)  in Pie Chart 


How the Russian Gas would affect the World Supply?

As can be seen from the above chart and table, Russia supplied about 14% of the World's natural gas.  The US and the rest of the World supply the remaining 86%.  With this kind of supply distribution,  it is hardly a conclusion that one can make to say the World's natural gas supply would be in trouble if Russia were to take drastic actions about supplying its natural gas.

Moreover,  the recent natural gas price hikes have already broken down the cost barrier and quenched the fear for many countries to consider bringing in LNG supplies from other countries instead of getting supply through the usual gas pipelines.

However, in whatever form the gas sanction or supply restrictions can be, they will not only bring temporary suffering & hardship to those countries who get direct supplies from Russia,  it will also hurt Russia's economy badly as well. Therefore,  it is never a wise decision to be made.

Update:  28 March 2022

China's Sinopec Bows Out Of Russian Petchem, Gas Projects

China has been taking natural gas supply from Russia, which is China's third-largest supplier of natural gas, after Australia and Turkmenistan, delivering 16.6 billion cubic meters (bcm) (pipeline plus liquefied natural gas [LNG]).  It accounts for 10 % of China's total imports. 

In Feb 2022, Russia, China agree 30-year gas deal via a new pipeline, to settle in euros.  Russia and China have been talking about this contract for the last 8 years,  Understand China signed the Contracts to reduce the dependency of supply from the "Quad".

Recent Russia's actions in Ukraine must have changed China's perspective.  China's Sinopec has just signed a 20-year contract to get about 4 mt of natural gas per year from a US company in November 2021.

<Doubleclick picture to go to the original webpage>


Sinopec was reported to have bowed out of $500 million Russian Petchem Gas projects just because one of the partners,  Gennady Timchenko,  has been sanctioned by the EU and Britain.  

<Doubleclick picture to go to the original webpage>


Update:  28 March 2022

Oil Production in Barrels per years by various countries

Similarly,   for oil production,  Russia supplied only about 11% of the oil requirement with the rest of 89% from other parts of the World as shown in this Pie Chart

a)  In numbers


<Doubleclick picture to go to the original webpage>


b)  In Pie Chart


Saturday, March 5, 2022

Runtime Error 429 in Using Selenium Basic


5 March 2022 

Selenium Basic can be a very useful tool when one is writing an Excel VBA Macro to "scrape" data from a webpage.  

In the past,  one will have to use "imacros" which is a special paid software for scrapping data in Excel because one cannot often use Excel's built-in "data queries" to extract data from a webpage.  These webpages are usually written using VBScript,  Javascript or other forms of HTML tools.  

Please click the picture for more information


The VBA that is used to extract data from a webpage using the normal tools can run into a lot of problems and often took several processes just to complete a simple task. Selenium Basic, on the other hand,  can cut the Excel macros down to just a few lines for the same kind of work.  For example,  it allows users to copy the whole table & then paste it onto Excel as an Excel table instead of a jpg picture.   It is much more efficient;  also, the VBA macros will run much faster,  limited only by the network.

Error Messages

The only snag about using Selenium Basic is the lack of support documents, especially about how to handle script errors.  This is because Selenium Basic is still in the early stage of development.  One of the errors that come up recently is the Run time error 429 as described by a forumer in the "Stackoverlow" forum:

Click the picture to visit the article

What is Error 429?

Error 429 is a common error occurring when one tries to automate office or other similar works. According to Microsoft,  this error when occurring in Microsoft Office VBA work could be due to the following reasons:

  • There is a mistake in the application;
  • There is a mistake in the system configuration;
  • There is a missing component;
  • There is a damaged component.

Microsoft suggested a few solutions as shown on this page.  The solutions can be summarized in simple terms as follows

1.  Check & verify the office application is working;

2.  Re-register the applications;

3.  Check & add the "CLSID key" to the Registry if there are missing in the Registry;

There are other methods suggested which the readers should read in detail. 

How the Error 429 happened?

It happened when one is trying to use special automation software called "Auto Power-On and Shut Down" to turn on and shut down the PC at a specific time automatically. This software has been used before for Excel macro many times without any hitch.  The Excel VBA macros were also tested to run well on another computer.  on this PC in question,  Windows Excel will startup but it would stall whenever it reached the following VBA script.  

  • driver.Start "Chrome"

The solution

The re-registration of the software "Auto Power-On and Shut down" as advised by Microsoft solved the problem.  One will need to run the following script in DOS-Prompt as an administrator:

  • C:\Program Files (x86)\Auto Power-On and Shut Down\Auto Power-On and Shut Down.EXE /regserver

In the above example,  the software,  "Auto Power-On and Shut Down",  was defaulted to be installed in C:\Program Files (x86)


Reviving ASUS eee901 NetBook PC for Data Scrappings

5 March 2022

# eee901, Network, SSD upgrade,  mSATA,  mini-PCIe,  Windows

This ASUS eee901 was a very popular netbook PC about 10 to 15 years ago.  It was one of the cheap netbook PC that uses SSDs for memory storage.   It was very hackable and many hobbyists like to do all sorts of modification work using this PC.  

Because the netbook uses only 5 Watts.  I bought a couple of these for stock data mining which required the PC to be operating 24/7.  When the SDD finally failed to work and plenty of free stock screening websites are available free for downloading,  I decided to retire them some 5 years.

Lately,  I took up the interest to do stock data mining again. This time is for data that are not available anywhere on the Internet.   The choice then was between buying a new netbook or upgrading the eee901 with a faster and bigger SSD.

What SSD Were Used?

These ASUS netbooks use a special SSD called mini-PCIe SSD.  These SSD has a similar form factor as the mini-SATA (mSATA) SSD.  Mini-PCI SSD is not easily available and mSATA SSD cannot be used to replace Mini-SSD directly in the ASUS netbook.

The Final Choice

.I decided to revive the eee901 for the following reasons

1)  Netbook has now been replaced by the tablets which run on either Android or iOS.  They are not good for running the Excel macros which were written earlier for data mining;

2)  There are adaptors available to convert mSATA SSD to mini-PCI SDD for use in eee901.  The adaptors are fairly cheap.   The SSD replacement and upgrading work is estimated to cost less than SGD$30/=. It is much cheaper than a new netbook;  moreover,  I have a few spare mSATA SSD lying around and I can use them for the upgrading work.

The only Snag

The eee901 PC has two SSD;  one 8GB master SSD that is accessible after removing the cover;  the other is the 4GB slave SSD that is hidden inside the PC.   When the new adaptor SSD is used to replace the 8GB Master SSD,  the PC will recognise only the new adaptor SSD as a slave.  The BIOS will always give this warning error about "master SSD not found" whenever the PC is booted up.  The warning error cannot be defeated because it is an error message.   It will stop loading up the Windows.  This is not good when one is trying to automate the PC to start up windows and run the excel macros automatically.   

Installing the adaptor SSD to replace the hidden 4GB will solve this startup error but the adaptor SSD must be shortened because the hidden 4GB is half-height.  It is around 50 mm long whereas the new adaptor SSD is around 70 mm long. 

Can the Adaptor SSD Be Shortened?

Yes,  it can.  One must use 1/2 height mSATA with a short piece of PVC plastic added as shown in this automated picture.  There is just enough room in eee 901 for the installation of this new and shortened adaptor SSD


How to Install the Inside the eee901?

Here is one of the video


Enhanced Performance

Users will find the replacement Adaptor SSD running much faster than the original SSD.  This is because the mSATA is of the more advanced Technolgy.  The mSATA's speed can be several times that of the original SSD.  

With the larger capacity SSD,  one can use the original Windows 7 with the response and speed,  at times,  even better than the Intel E8400 PC with the hard drive.  Some has tested eee901 using Windows 10 but the response was a bit sluggish as reported because Windows 10 will require 3 GB RAM to run efficiently.  The eee901 only has a maximum RAM of 2 GB.

Sunday, February 20, 2022

DIY Protective Covers for Continuous Glucose Monitoring (CGM) Sensors


19 February 2022

About 1 in 10 people will have diabetes. This number of diabetes is expected to double in future years.  It is a serious disease that will cause death if it is not properly managed and controlled.  The disease is more commonly found in aged people.   People get diabetes when their blood glucose is too high.  This glucose in the blood is commonly referred to as blood sugar, 

This article will not go into details about controlling and managing blood sugar as there are lots of good articles written about this on the net.   I just want to share about how to DIY a  cover for the Continuous Glucose Monitoring (CGM) Sensors when one happens to wear one.

What is Continuous Glucose Monitoring (CGM)?

There are generally 2 common types of methods to measure the level of blood sugar at home.  One of them is by using a glucose meter with a special test strip;  


the other is by using a special sensor that has to be planted on our body.   


The former is most commonly found at home and have been used for years.   The latter is only available in recent years.  It is by far the most effective way to control and manage the blood sugar in our bodies.  More details about CGM can be found here and elsewhere on the net.   This article will only talk about how to best secure and how to DIY a cover for the  CGM Sensor when it is installed on our body.

Why the need to secure the Sensor?

Usually,  the sensors are provided with means to secure the sensor to our body as one can see in the above picture,  But it does not look really very secure.  It is not that it will fall off that easily;  it is just the feeling of most people who wear them that the sensor could just "shear off" when it hit against something like a door jamb.  Besides,  there is always this sensation of arm-sore that will not go away even after days of wearing the sensor.  This could be because the needle of the sensor could be moving around when one is flexing the arms.  

As such,  one can find a lot of companies selling specially made covers or patches to secure these sensors.  They are not cheap either.


How to DIY the Cover?

There is actually no requirement specified by the manufacturer nor there are any standards available for the design of the sensor cover.   It is generally felt that the cover should have the prerequisites:

a)  It is waterproof;

b)  It must have a strong adhesive to stick firmly.  Easily replaced.

c)  It must not cause skin occlusion 

It must be waterproof so that water will not soak the sensor or its adhesive base when one is taking a bath.  It must have a strong adhesive itself to stick firmly to the skin & easily replaced.    Most important of all,  it must not cause skin occlusion which will often cause skin irritation,  leading to skin rashes or inflammation.  

Searching around,  we found the 3M micropore tape or similar most suitable for the DIY as it fit the 3 prerequisites.  The 3 M tape comes in 4 sizes,  the 3",  the 2",  the 1" and the 1/2".  The most common one found in the self is the 2",  the 1" and the 1/2";  but,  the most suitable one for use as a cover for the sensor is the 3" type.    

How to Use the Smaller size 3M Tape?

The only way is to join the pieces together using the following step by step.  In this case,  the most suitable one is the 1" type.

1)  Cut 3 pieces of 1" tape;  each tape is best to be roughly about 3.5 in length;

2)  Laid the tape on the glass.  In this example,  a mobile phone was used;


3)  Lightly place the 3 pieces of tape,  overlapping the edges as shown attached.   Apply some pressure over the overlapping edges to stick the pieces together;


4)  After that,  remove the tape;

5)  Cut a small round piece of plastic using a small bottle as the template as shown as stick the round piece right in the centre.  the plastic round piece should be larger than the adhesive of the CGM sensor.  This is to ensure the tape will not stick to the sensor and the adhesive and the tape can be easily replaced if necessary;


6)  Trim the DIY sensor cover and place the cover over the sensor as shown.


iPhone and iPad: How to Create a Short Cut in Home Screen to Clear Cache & History

23 November 2024 What are Cache and History? Cache and browser history store information about websites you've visited.  The C ache s to...