Search This Blog

Sunday, July 16, 2023

Singapore Airlines (SGX:C6L) Technical Analysis

16 July 2023


In the last post on 8 July 2023,  we said that the SIA price was forming another Flag.   This Flag2 has now been completed as shown in the following chart. 


If the SIA price can pierce through the top of the flag pole (colored green),  we might see the SIA price makes attempts to cover the candlestick gap created on 30 July.   


About the Candlestick Gap


When Temasek Holdings sold away 400 million shares on 30 July,  it created a candlestick gap with a price drop of S$0.35 or 5% as shown in the following chart


This gap is not only large but also has a trading volume of 85 million shares.  This share volume was about 13 times the average 100-day trading volume.   It is definitely a “runaway” candlestick gap.


According to the textbooks,   a “runaway” candlestick would usually take months or years to fill.   Those interested to know more about  runaway candlestick can find more detail here


Why are They Selling?


SIA has been performing rather well after the end of the pandemic.  In 2022,  It has posted the highest net profit in its entire 76 years of operation.   Some traders have expected the 1Q2023 earnings to be even higher.   Then why are the big players selling? 

Earlier on,  we posted that the broker houses and the analysts expected 

a)   A tapering in the number of air passengers,  leading to a decline in earnings.  

b)  The SIA to spend

 1) Billions to redeem the mandatory convertible bonds (MCB) they raised in March/April 2020.   

2)  A lot to renew its aircraft fleet, plus

c)   The SIA to allocate funds for the merger of the Vistara/Air India group. 

One other reason that has not been speculated so far is whether the SIA price has been running up too quickly too fast in 2023.

Is SIA Price Running Too Quickly Too Fast?

Presently, the World’s 5 best airlines in 2023 are

1.      Singapore Airline

2.      Qatar Airways

3.      ANA All Nippon Airways

4.      Emirates

5.      Japan Airlines

Except for Qatar Airways which is 100% Qatar Government owned,  the rest of the airlines are listed companies where we can compare their stock prices. 

It can be seen from the following chart and the table that SIA price has indeed been running way ahead among the airlines for the last 6 months in 2023.  Its price has more than  doubled the prices of other airlines


Going forward,  we would expect very strong resistance for the SIA price to break the top of Flag2.  It would be even harder for SIA shares to cover the candlestick gap unless the big players can reverse their earlier decision and decide to enter the market again.  Breaking up the resistances can only happen soon if the SIA's 1Q 2023 results to be announced on 27 July are so unbelievably good,  prompting players like Temasek Holding to regret and to buy back the SIA shares. 


8 July 2022

In the past week after Temasek Holding sold 400 million SIA shares and after 3 or 4 broker houses and analysts downgraded SIA had set a target price of S$6.80,  the SIA prices have been going strong as shown in this stock chart. 


We can clearly see that the market wasn’t ready to send SIA down immediately. The SIA prices have defied and made an attempt,  trying to recover from when the prices closed up from a one-month low of S$7.15 on 30 June to S$ 7.32.  The price gained about 2.3% for the week.

Isn't the Price going down to S$6.80?

No one can tell at the moment as this has not happened yet.  There is nothing concrete about the target price set by the broker houses/Analysts. The price could change due to traders' sentiment and prevailing news. Temasek Holdings can also make the price jump again for example. 

This technical chart is showing exactly the situation.  


The SIA price is presently raising its head above the trendline T1.  It is ready to head higher as long as it can stay above this trendline T1.  However,  we are spotting another bearish flag being formed.  It is marked as flag 2 This flag would take the SIA price higher to about  S$ 7.40 before touching the flag top and before deciding if it is going to go down again.


Can the Bearish Flag Pattern Fail?

There is nothing concrete about the result of any kind of analysis.  This is especially for stock Technical Analysis.  They can only be used for reference.  

Technical Analysis is only telling us that there is a possibility or there is a potential.  They cannot tell us about the minds of the traders and what they are going to do next. 

There are many examples one can find on the Net about how Technical Analysis had failed;  for example,  a bearish flag can turn out to be a bullish flag in the end.  

Here is one textbook example  This webpage is giving us some advice on how to spot a  bearish or bullish flag and how to trade when that happened.


How to Spot a Failed Flag Pattern?

The textbook has this to say:

A properly formed flag would have the following features:

1.   1.     Trading volume should increase just before the flag is formed;

2.   2.     Trading volume should then decrease while the flag is being formed;

3.   3.     The price should touch the top  of the pole for a bearish flag or vice versa to complete the flag;  finally and most importantly;

4.   4.     The volume must increase again when the price breaks the lower flag pole for a bearish flag or the upper flag pole for a bullish flag.

The SIA price pattern fits exactly these descriptions for a bearish flag to be formed.

Going forward,  traders are advised to be on alert and watch how the price form the bearish flag.


8 July 2023

Singapore Tourist Arrivals 2023

The tourist arrivals to Singapore were around 1.1 million for June 2023 as shown in the attached picture. This figure has been maintained over the last 3 months and doubled over the year as compared to 543,000 in June 2022.  The Singapore Tourism  Board (STB)  has predicted that Tourist Arrivals to Singapore would be in the range of 12 to 14 million in 2023.  To date,  tourist arrivals to Singapore have risen to 12.59 million,  which is an increase of about 586% YOY.


30 June 2023

Temasek Holdings Selling $400 million worth of SIA shares

This news about Temasek Holdings selling SIA shares has caused Singapore Airlines (SIA) share price to tumble and lost 4.76% or S$0.35 per share today.   It has also formed a glaring candlestick gap as shown in the following chart.


Temasek Holdings explained that it is always their routine "to reshape and rebalance their portfolio so that they can deliver sustainable returns over a longer term."  Temasek Holdings also said it would continue to be a significant shareholder in SIA with a 53.5 percent stake.

While some market investors and traders have taken this reason for granted and expected the SIA stock to return to its former shine,  many others were trying to understand why Temasek Holdings was selling those SIA shares especially when the SIA share prices were so bullish lately.

What are the Reasons to Sell?

The following reasons were speculated.  Temasek Holdings was:

1. Taking a profit;
2. Expecting a decline in the SIA’s earnings or
3. Diversifying and channeling profits for another business

The SIA Rights Issues

In March/April  2020,  Temasek Holdings took up about 986 million rights shares issued by SIA.   Then the right issue was S$3/=  per issue.   In addition,  Temasek Holdings has also taken up S$1.94 billion of mandatory convertible bonds (MCBs).

For this reason,  some netizens claimed that Temasek Holdings could earn a tidy profit of over S$1.8 billion by selling away 400 million shares.  But this reason could not hold water because Temasek Holdings' remaining 53.5 % stake would be severely affected by the stock sale.  Therefore,  the better reasons would be point (2)  or (3) with point (2) being more likely.  

The Brokers' and Analysts' Analysis

Some brokers and Analysts have turned more cautious lately about buying SIA shares.   They expected a tapering in the number of air passengers,  leading to a decline in earnings.   They also expected SIA to spend billions to redeem the mandatory convertible bonds (MCB) they raised in March/April 2020.  Furthermore,  SIA was also expected to spend a lot to renew its aircraft fleet plus they would have to allocate funds for the merger of the Vistara/Air India group. 

As a result,  many Brokers and Analysts have called to downgrade the ratings of  SIA stock.  For example,  PhillipCapital has reduced SIA's target price to S$6.80 while DBS has downgraded SIA to ‘hold’ with the same target price of $6.80.  POEM also reduced its ratings and  target price 

Example of what would happen?

A good and similar example is when Temasek Holdings sold about 3% or 62 million shares on 11 March 2012 or 12 years ago.  That stock sale reduced Temasek Holdings' stake in Sembcorp Marine Ltd (SM) (S51.SG) from 63.95% to 60.91%. Then SM's stock price was about S$3.05 (adjusted price).  The sale caused the price to drop 5% on the next trading day and a candlestick gap was formed as shown in the following chart.     This candlestick gap was covered within the next 2 weeks.  The price then fluctuated between S$2.30 and S$3.00 for the next 6 months.  It dropped by 7.7% in November when SM reported a 48% fall in the net profit for 2Q 2012.


What is the Takeaway?

In the SM example,  Temasek Holdings might have done its due diligence and found SM would have a bad 2Q report.  Temasek Holdings could reap a tidy profit of S$49 million without losing a single share if they were to buy and replenish back the 62 million shares after the 7.7% drop in November 2012.  


Would the SM's example repeat in SIA?

The example might be repeated in SIA.   In fact,  it could be repeated again and again anywhere. 

Let's examine the SIA's stock chart closely.  The chart is showing that SIA stock has formed a bearish flag as marked in red.   This flag has a target price of S$6.86 according to the technical books.  And this S$6.86 also happened to be a strong "technical support" for the SIA stock.  It is also the target prices of the 3 brokers/Analysts that were quoted earlier.   Like the SM example, the SIA price might have a leg down to find solid support at around S $ 6.80.   It is also very likely the candlestick gap formed today would be filled sooner or later.


Whether the SIA would have a bad 2Q or the 3Q report in 2023 like SM in 2012 would be anybody's guess.   But it would be advisable for investors to be cautious and do the necessary due diligence before buying or loading more SIA shares.
 
Disclaimer:  This article is for information and educational purposes.   Readers are advised to conduct their own research and study to make their own investment decisions.

Tuesday, July 11, 2023

ISDN

10 July 2023

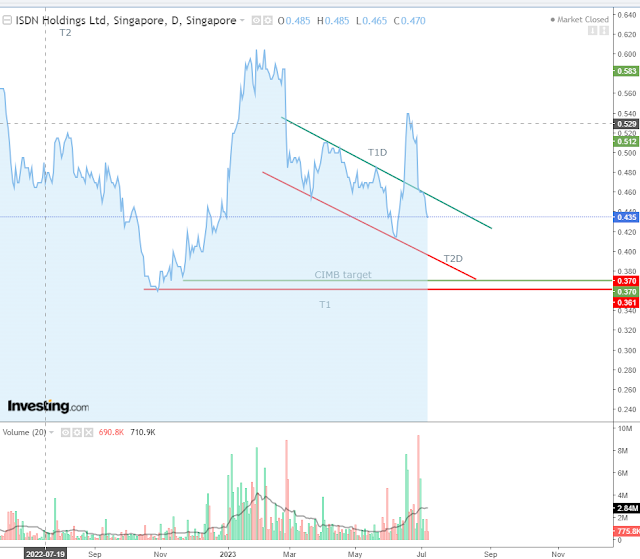
CGS-CIMB,  a broker house in Singapore downgraded ISDN to 'reduce' holding on 27 June 2023 They gave a target price of S$0.37.   This target price is about 32% lower than the highest closing price of S$55 on 20 June.  They were of the view that China's performance will be weak in the coming months.   An excerpt of the  CIMB report can be found here.  It was also summarised in this article.


According to TradingView,   ISDN derived about 65% of its revenue from China as shown in the following graph.


As a result, ISDN's share price dropped  9.7% or S$ 0.05 from S$0.515 to 
S$0.465 on 28 June.  It then dropped for the next few trading days to close at S$0.435 on 7 June,  about 15% down since the day the counter was downgraded.  The price dropped further on poor market sentiment and ended with a price of S$4.35 on 10 July 2023,  about 20% down from its recent peak on 20 June 2023.

A question remains as to whether ISDN would go as low as S$ 0.37 as predicted by CGS-CIMB or it would bound and recover quickly from this nasty fall.

About ISDN

ISDN Holdings Ltd is a Singapore company specializing in the provision of automation solutions and services ranging from precision components and engineering services.  It provides also specialized Engineering Solutions, Industrial Computing Solutions, and Other services. Off late,  it has ventured into renewable energy solutions.  A mini-hydro power plant (10 MW) in Lau Biang,  Indonesia was completed and commissioned in December 2022.   Recently,  it said it has obtained permission to commission another  2 mini-hydropower plants in Anggoci (10 MW) and Sisira (4.6 MW),  Indonesia.  Earlier on,  it has associated with a firm called AEnergy which has operated a few hydropower plants elsewhere in Indonesia   Presently,  the ISDN is still holding about 67% of the stocks in AEnergy according to the 2022 annual report.


About Hydro Power Plant 

For those who are not familiar with Hydro Power Plant,  here is one good article to read.  In short,  hydropower can provide a  low-cost electricity and green solution as compared to other sources of energy.

Can Hydro Power Help the Bottom Line?

The answer is definitely a yes.  

When the ISDN's first hydropower project in Lau Biang was completed and in operation during December 2022,  ISDN claimed that this Lau Biang plant would add about 18.5% to the group earnings based on  2022 earnings.  This earning is worked out to be around S$2.5 million per year based on the S$15 million annual earnings reported on  February 2023.   The Lau Biang plant is 10 MW and the 2 extra plants in Anggoci and Sisira will add another 14.6 MW.  

By mathematical proportion,  It is estimated that the 3 plants will add another S$5 million per year toward the earnings of ISDN.  But, there is always a "but" for reasons to be explained.

Reasons

1.   Hydro Power Plant constructions are Capital Intensive
 
Hydro Power Plants are cost-effective projects but a worthwhile investment.  It unit cost of development is more than  US$2000 per KW.  This is almost twice as much as compared to the fossil fuel power plant.     

In the US and in other countries where electricity tariff is moderately high,  the hydropower plants would have an internal rate of return (IRR) of more than 14%.  The payback period is usually within 10 years.  But in Indonesia where the electricity tariff is kept low.  around US$0.09 per Kwh, the internal rate of return (IRR) is usually less than 10% and the payback period could exceed 10 years.

2.  There are certain risks in hydropower plant investment in Indonesia

a)  The Government could change the policies under political pressure.  Not too long ago in 2020, they put a capacity cap on how much hydropower plants can generate and they buy the excess power only at half price.

b)  The power generated is assumed to be sold PLN, the local electricity board.  PLN has a Power Purchase Agreement (PPA) that could restrict the sale and change the selling price.  This selling price is generally about 85% of the tariff.


Technical Analysis

Technically,  we are seeing ISDN trapped in a downward channel which is supposed to be bullish going ahead when the price can break the resistance trendline T1.  The CIMB target price of S$0.37 is very close to the support at S1 according to the following weekly chart.


If we zero into the daily chart,  we could see that the ISDN price is bouncing between the channel labeled T1D and T2D at the moment.  It has broken up but was forced back into the channel by the CIMB price downgrade.

Going ahead,  we are expected to see the price to stay within the channel.   For information,  T2D,  marked in red,  is one very strong support;  breaking it can cause volatile trades.  if this T2D support is broken, the ISDN price will want to test the support S1 as shown in the above weekly chart.


The Candlestick Gap 

There are 2 candlestick gaps spotted in the ISDN chart.  One happened to be on 27 February 2023 and the other,  recently, on 28 June 2023.  

The one on 27 Feb was created by the ISDN's report about a 42% falls in the annual net profit;  the one on 28 June  was caused by downgrades from CIMB.


On both occasions, the trading volume on the day was over 5 times the 100-day average daily volume.  This volume is significantly large.   

According to some textbooks, they can be classified as runaway gaps.  It might take months or years to fill.  

As these gaps are earning-related, the gaps could be filled if ISDN can produce a good earning report to convince the investors.  The next half yearly result would be around September 2023. Hopefully by then, there will be good earning news. 


Wednesday, July 5, 2023

Put/Call Ratio As an Trading Indicator

4 July 2023

Put/Call Options in the US market have been used by investors to hedge their investments in equity and other markets. For example,  when investors invest heavily in stocks,  they might want to buy some put options to mitigate their risks and vice versa.   Because of this purpose,  we often see call-and-put options being used to chart the market direction.  

We can find the daily trading of Put/Call options in the Chicago Board Options Exchange (CBOE).  This is their webpage.  We can also find many websites giving free Put/Call Ratio charts;  for example, this chart is in StockChart.


Unfortunately,  these charts are only able to tell us the present and not the future trend.  For example,  the above chart is telling us that the equity market is getting stronger because the Put/Call ratio is trending slightly downward.  It cannot tell us if this trend will continue.

Trending the Future

To look at the future trend,  we should expand the chart as shown.  We could clearly see the trend from the following chart: 

The Chart is now able to tell us not only the present trend but also the trend in the coming future.   It can also tell us roughly when to buy and hold or when to sell the equity.

For added clarity,  we could remove the daily wiggling line and then add in the 20,  50, and 200-day moving averages (MA) as shown in the following chart.  This new chart will tell when to buy or sell.  That is,  we should start to buy when the 20 and 50 MA is staying consistently below the 200 MA;  otherwise,  we should start to sell.   

The most rewarding time is when the 200-day moving average is trending downward like in early 2020.


Disclaimer:  This article is for information and educational purposes.   Readers are advised to conduct their own research and study to make their own investment decisions.


Sunday, August 21, 2022

US Stock Movements

Jump to

23 Aug 2022  20 Aug 2022


back to top

23 August 2022

DOW started its descent with a "bang" of more than 600 points yesterday after breaking the red trendline. It has also broken the Support1 which was not marked earlier.  In addition,  it has created a new candlestick Gap3 as shown.  

With the creation of Gap3,  the following options become available:

1.  Cover up Gap 3 immediately;

2.  Cover up Gap 1 before covering Gap 3;

3.  Proceed to cover up Gap1, and test the other supports to cover Gap2 before coming back up to cover Gap 3;.

From the observations of the other trending charts,  it would appear that the traders were creating Gap3 for the purpose of returning back after having covered Gap2. Also, if they wanted to cover Gap3,  they would have already done so during the trading session.  

The observations also support option 3 to be a likely trading option at the moment unless another incident like the "2008 Lehman Brothers" event were to happen again.


back to top

20 August 2022

The US stock has reached the overbought region and is ready to make a descent.  The descent will start as soon as DOW breaks the red trend line as shown.   Thereafter, it will try to cover gap 1 and test the support @32,387 as shown.  


Saturday, August 20, 2022

How Best to tell if Market has really Bottomed?

18 August 2022


Jump to 


This is presently the most pressing question that many would want an answer to.  Some chartists speculated that the present US market trend is just like in 2008 when the market is expected to undergo another downtrend or drop before it can recover.  

Some went as far back to draw charts and superimpose the charts of 1937,  2000, 2008, and 2022 to prove their points.  This article will show how the market has really bottomed and if we should enter the market now.


When will Market Bottom?

The market often considered to have bottomed when there are more than 80% of the stocks hit their 200MA as predicted earlier on 26 July 2022


What if This Happens Again?

The market may cause a secondary bottom and collapse again like it had happened on September 15,  2008, when Lehman Brothers went bankrupt.  On that very day,  the Dow Jones Industrial Average had lost 4.5%,  the largest since the  911 Terrorist attack on the Twin Towers in New York on September 11, 2001. 


How to Tell if such a thing will happen again?

To know how to tell, please click the "Reveal" button to see the next chart. 


This chart shows that there were 2 events that caused the market failures and did not recover after the market stock hit the 200MA baseline. These 2 events are: 
  
a)  Lehman Brother Event (Marked Event 1 in the Chart)

Before the Lehman Brothers event,  the market was running on another track in 2007 as shown.  The stocks hit the 200MA around March 2008 & recovered.  When Lehman Brothers declared bankruptcy on September 15, 2008,  the market hit the 200MA again.  This time,  it went really down under, changing also its course to run on a new track as shown.

b)  The Covid 19 (Marked Event 2  in the chart)

This event started by Fed's QT in 2018/19.  The market recovered after stocks hit the 200MA in 2019 but it was soon spooked by the Covid19 break out in China.   The secondary bottom appeared only after the US Government started up the 3 Trillion USD Covid Stimulus packages in March 2020.


In Conclusion

If there is a similar happening like Lehman Brothers appears this time,  it is likely to do exactly the same.  It will run down and break the red trend line as shown before recovering.  It might also run on an entirely different track like 2008/09 if the secondary bottom were to be as bad as the Lehman Brothers event.


Disclaimer:  This article is for information and educational purposes.   Readers are advised to conduct their own research and study to make their own investment decisions. 


Sunday, August 14, 2022

The Labour Force Participation Rate (LFPR) as Stock Indicator

14 August 2022

The labor force is important in any economy.  An increasing labor force indicates healthy economic growth.    The scale of labor supply in a country is often measured by the labor force participation rate (LFPR). Therefore,  the higher the LFPR,  the better and healthier will be the economy and vice versa.  Investors often use LFPR to judge an economy before laying out their investment plans.

Examples 

Germany

Germany has been regarded as one country that has a better and healthier economy not only in Euro Area but also in the World.  In the past 20 years,  Germany's participation rate has risen steadily from about 70% to the present 80%.  It has managed to maintain positive GDP growth every year except for 5 occasions marked as shown in the attached chart.


Other Countries

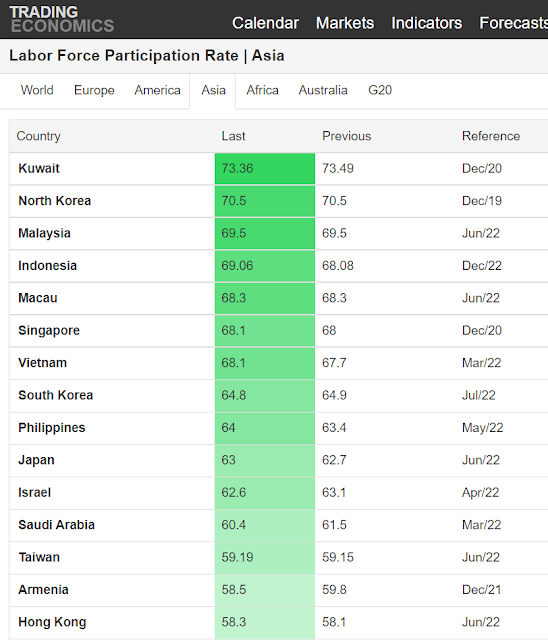
The following chart shows the labor force participation rate as listed in the World Bank's record.

G20 Countries


Asian Countries


Where to get the Data

The Best Places

2.   World Bank
3  CEIC *

* likely to be using models to project/estimate when National figures are not available

Why China is not included?

For some reason,  China stopped reporting its National LFPR in 2016 as shown in this World Bank Chart. 
DoubleClick picture to visit the webpage


One could only read from the model that predicts and projects the latest figure.  The last projected figure is 68%.
DoubleClick picture to visit the webpage

Why has China Stopped Reporting Since 2016?

China suffered the weakest annual growth in 26 years in 2016 when it reported a GDP growth rate of 6.7% , down from 6.9 % in 2015.  There was a job loss of about 1% in that year according to this chart from Moody's Analytics. Since then,  China had not been reporting good labor force statistics.  It is not known if this is the real reason.

DoubleClick picture to visit the webpage


The Younger Labor Force

The younger labor force participation is often regarded also as an important statistic to judge the health of an economy.   The following World Bank chart shows that China has stopped reporting such statistics since 2010.  Most economies have reported lower LFPR after the pandemic in 2020. 

DoubleClick picture to visit the webpage

The LFPR & Stock Market

The LFPR might not be the best indicator to track the movement of the stock market but it can be used to predict if there will be a large market movement as shown in this chart.  The better indicator to track the stock market is the payroll figure at the moment

As of 14 August 2022,  the chart is showing a very healthy LFPR for the US labor market.  If not because of the pending Fed's QT  in session,  the US stock market could have recovered and taken off to make new highs.


Real Time LFPR& Stock Chart

source: tradingeconomics.com


Conclusion

Labor force participation rate (LFPR) has always been used by analysts all over the World to judge the strength of an economy.  A rising economy would have a rising LFPR.  Of late,  many economies are suffering from declining LFPR particularly in the age between 15-24,  the younger labor force.   China has purposely chosen not to report the LFPR since 2016.  However,  many analysts still use models to estimate and project this LFPR from China.

Disclaimer:  This article is for information and educational purposes.   Readers are advised to conduct their own research and study to make their own investment decisions.

Saturday, July 30, 2022

Stock Market of China, Taiwan, Hong Kong and the US in One Chart

30 July 2022

This article is making an attempt to find how the various stock markets in China,  Taiwan,  Hong Kong, and the US interacted with each other after Mr. Xi JinPing became the President of the People's Republic of China (PRC) in March 2013.  

For clarity,  this article compares the main indexes of the 4 markets all in one single chart.

What Chart?

This chart was drawn using the performance chart inside stockchart.com


The chart started by saying Mr,  Xi Jin Ping took office in March 2013.  He succeeded Mr. Hu JinTao,  becoming the 7th President of PRC.

The Achievement of Mr. Xi JinPing

Xi is well known for his anti-corruption practice and the one Belt One Road(OBOR) initiative. Economically, the PRC people see him as a successful President who is behind China's export-driven growthXi's achievement must be the reason behind the super growth of the Chinese stock market in mid-2014.

The Chinese Stock Market Bubble in 2015/16

During Xi's term in 2014, the Chinese Yuan or RMB became one of the world's top five payment currencies, overtaking the Canadian dollar and the Australian dollar.  

The Chinese traders/investors could have seen it as an opportunity to make some quick money.  They were reported to often use borrowed money to buy stock.  This unfortunately caused China's stock market bubble to burst on 12 June 2015.  

The Chinese stock market bubble eventually ended around February 2016.  The Chinese markets have not quite recovered since.

The Hong Kong Stock Market

While the Chinese markets were flourishing to form the bubble,   the Hong Kong market remained quite steady, trailing behind the rest of the stock market until the Hong Kong Street Protest broke out in March 2019.  

The Hong Kong market dropped about 35% during the Hong Kong Street Protest but gained back about 25% after the introduction of the Basic Security Law on 30 June 2020.  But this gain was quickly erased when the Hong Kong Exodus started after the UK government introduced a new visa scheme for holders of the British National (Overseas) passport.

The Taiwan Stock Market

As shown in the chart,   the Taiwan stock market had a better time compared to Shanghai and Hong Kong markets.  It appears to trace closely behind the US market after 2020.


Simple and Easy Way To Backup Photos, Movies and Documents from handphones

 2 December 2023 In the past,  we used iTunes when we wanted to transfer or backup our photos,  movies, and documents from iPhones or Androi...