Search This Blog

Saturday, July 22, 2023

Singapore Stock: Keppel Corporation Limited (SGX: BN4)

21 July 2023

Today,  Keppel Corp’s trading price dropped from  S$6.96 to S$6.79.  This is a loss of S$0.17 or 2.44% from Thursday's closing price. It is the largest price drop in 2 weeks since 6 July.

The news today about the Keppel Fund has acquired a building in Seoul for an undisclosed sum must have been responsible for the drop in today's price.   

About the Acquisition


With this latest acquisition,   Keppel claimed to have about 1.4 trillion Korean won ($1.5 billion) worth of deals in South Korea since 2021.  The total assets in South Korea under its management (which includes the Samhwan Building and waste management company, Eco Management Korea Holdings) are now about 2.6 trillion Korean won or S$ 2.6 billion.

The Estimated Cost of the Acquisition 

According to Google Search,  Keppel Corp has made the following deals since 2021

a) The acquisition of Samhwan Building 

This building was acquired in 2022 for a sum of about KRW220 billion ($228.7 million).   It is located in the Jongno central business district in Seoul.  It is a 15-story building that has a total gross floor area of 31,403 square meters. 

         b) The acquisition of Waste Management Company

c)  The acquisition of the Sheraton Seoul D Cube 

Keppel Investment Management, the South Korean arm of Keppel Capital Holdings, purchased Sheraton Seoul D Cube for KRW131.7 billion ($117.9 million) in Novermber 2021.  It intended to turn the hotel into a commercial office building.

Therefore,   one can roughly estimate that the Sogong Annex could have cost Keppel around S$480 million (S$1.5 billion - S$230 million - S$666 million - S$120 million) unless there are other acquisitions not found by googling.

Unit Cost of the Acquisition

If S$480 million and the gross floor area is 15,750 sq meters,  the unit cost per sq meter for this acquisition will be S$30,000 per sq meter.  This will be the most expensive building Keppel has purchased so far in Seoul.  

In comparison,  this building is more expensive than Singapore's Shenton House in CBD which has a unit cost of about S$13,000 per sq meter,  In the details of a recent collective sale,  the reserved price put up was S$600 million.  The Shenton House building has a gross floor area of 48,000 sq meters.  

However,  we could not use this Singapore's unit measurement to judge if the unit price of Keppel's latest acquisition is expensive. We will explain more when we talk about the "takeaway".

The Locations of Buildings

The exact location of the Sogong Annex and Samhwan Building is shown in this Google map.   Songang Annex is right in the center of the CBD area and very close to the Seoul Tower.  It must be in the very prime area which demanded a higher unit price.


Why the Price Drop?

As the actual acquisition price of the building was undisclosed and most were not familiar with the property prices in South Korea to assess if the purchase price was fair and reasonable,   many traders must have been working on the “sell first,  talk later” mode to protect their capital.   


Technical Analysis

The following chart shows that Keppel Price has almost broken the trendline T2 and was up and running to scale higher high until this news about the acquisition of the Seoul facility broke up on 21 July 2023.    The news sent the Keppel price below Trendline T2 and is now preparing to test Trendline T1 again after bouncing from it on 7 July. 


Going forward,  we are expecting Keppel Price to test the support at S1 first.  If S1 failed to hold,  it will want to test again the support at T1. 


The Takeaway

a)   Price of Acquisition

The acquisition may be a bit frightening at first sight,  especially when the price was undisclosed.   The information was not properly and clearly articulated as to how such an acquisition could have affected Keppel’s future business.     

There must be good reasons why Keppel decided to buy the Sogong Annex although it is much more expensive than the price of Samhwan Building which it acquired in December 2022.  This is because the location of Sogong Annex is in a very prime area.  It is just about 1.3 km from the Seoul Tower.

According to this Korean economic news, office building prices in downtown Seoul set a fresh record high in 2021.  The highest unit price at that time surpassed KRW 40 million per one pyeong or 3.3 square meters.  This is around S$120,000 per sq meter.  This price is almost 4 times more than the S$30,000 per sq meter paid by Keppel for the Sogong Annex building as shown in the following table


b)  The Assets under Management (AUM)

Presently,  Keppel’s business is spreading across 6 areas of the Globe as can be seen from the following photo extracted from Keppel’s 2022 annual report


It can be readily deduced that these assets under management (AUM) in South Korea are just a small part that contributed very little towards the revenue of $6.6 billion in 2022.  The biggest part of more than 80% comes from businesses in Singapore.   Moreover,  Keppel Capital presently has S$50 billion of Assets under its management (AUM) and they are working toward a target of  S$200 billion of AUM.    The S$480 million for this acquisition of Sogong Annex is less than 1.0% of the S$50 billion of AUM.

c)  The Office Rental Price in Seoul

Although the housing market in South Korea was not as rosy as before and the price of housing properties has dropped since 2022,  there are reports that the price had stabilized in June as buying of properties in Seoul improved.   

As for the office rentals,  the latest report from Cushman & Wakefield said that the good office space vacancy in Q2 remained steady at 2.6% and the average monthly rental continued to rise at a rate of 1.2% YOY and 8.4% QOQ.


d)  Properties Sold with Gains

Keppel was able to make money from the property business in Seoul in the past few years after acquiring and value-adding the 3 Grade A buildings in Seoul in 2019.  They sold the 3 buildings away in 2021 for a handsome profit.  


Conclusion

In conclusion,  we do not foresee the acquisition of the Sogong Annex will have much material impact on the coming earnings of Keppel Corp.   Also,  we cannot conclude that the price of the latest acquisition of the Sogong Annex by Keppel is expensive.

Disclaimer:  This article is for information and educational purposes.   Readers are advised to conduct their own research and study to make their own investment decisions.


9 July 2023

In the article dated 5 July, we wrote about Keppel’s price being trapped in a rising expanding bearish wedge as shown in this weekly chart.

Since then,  the price has been further developed when we revisited it on 7 July.  

 (Note:  Corrected using adjusted price.  The original chart using investing.com was not adjusted for distribution in Specie of Sembcorp Marine share)

We can see from the newer chart that Keppel’s price is about the test the trendline support T3 very soon.  If it can bounce from this trendline support T3,  Keppel's price can be very bullish. 

On the other hand,  if the price took a turn for the worst for some unknown reasons, and the prices were to break the trendline support T3,  things could turn ugly.  Trading after that can be very volatile especially when the trading volume is large at a time when it breaks the trendline.  This is because the trendline T3 is one very strong support.  It is a Head and Shoulder line. When that happened,  we would expect Keppel's price wanting to go lower lows. 

In the daily chart as shown below,  we saw the price has broken the orange T2 trendline.  It has turned trading sentiment bearish and traders are expected to bring the price down to test the strong Trendline T3 as discussed earlier.


Going forward,   we hope Keppel's price can bounce after hitting the trendline support T3.   This is because many broker houses have higher targets.  In addition,  Keppel has signed recently to work together with Petronas Malaysia's Gentari to develop renewable energy projects.  Presently,  Malaysia has an ambitious renewable energy target, aiming to reach 70% of renewables in the power mix by 2050.   This target is slightly bigger than the target set by Indonesia which is 2/3 power mix by 2050. 


5 July 2023

Keppel Corporation Limited (SGX: BN4), in short,  KepCorp,  is one of the pioneer companies in the SGX exchange.  It was incorporated on 03 Aug 1968 and listed in SGX on 24 October 1980.   The group was originally in the offshore and marine engineering and construction services.   It has now expanded to become a global investment holding and management company and the operator of infrastructure, power stations,  district cooling, and other business like real estate in Singapore as well as in many other countries like China and Malaysia.  

Present Price Trend

KepCorp has a bullish trend at the moment.  This weekly chart shows that It has broken the red trendline in early 2022. This red trendline has been trapping KepCorp's price movement for the last 8 years since 2014.    KepCorp's price is now moving in an uprising and expanding wedge,  enclosing by trendline T2 and T3 as shown. 

(Note:  Corrected using adjusted price.  The original chart using investing.com was not adjusted for distribution in Specie of Sembcorp Marine share)

StockTarget Date

KepCorp is presently trading in SGX for about S$6.60 per share.  The target price of most broker houses and analysts is in the range of S$7 to S$9 as shown in this sgInvestor picture.


Present Stock Movement

KepCorp's price is presently trapped in an up-rising channel as shown in the following daily chart.  It has a resistance (R1) at S$7.11 and a supporting price  (S1) at S$ 6.53. We expect YZJ will move within the channel marked as T1 and T2.  If KepCorp's price can break T1,  we should see higher high prices; otherwise,  we should expect the price to move lower. 


For information,  we have also found an additional trendline that might show how the price will move in the shorter term. This trendline, marked in orange,  will guide the price movement in the meantime.   If the price were to break below this orange trendline,  we should expect KepCorp to test the support at S$ 6.23 (S2)


The Candlestick Gap

Just like SembCorp Industries,   KepCorp has a price shock on 19 June 2023 when EMA announced a temporary power cap for power generation in Singapore. In this event,  KepCorp has created a candlestick gap in the 60-minute chart as shown in the following chart.  In addition to the gap created on 16 June 2023 for the removal of Keppel DC REIT from the Straits Times Index (STI), KepCorp has a total of 2 candlestick gaps to cover.  

As these gaps are not "runaway gaps" and not created because of significant events happening in KepCorp,  they will be filled soon according to the textbooks.  Therefore,  we are expecting KepCop's price to move up to cover these gaps in a matter of time.


Stock Market Performance

KepCorp's stock price was not performing as well as its peers like SembCorp industries.  This can be seen from how the price recovered after the recent fall caused by EMA's temporary price cap announcement.   

SembCorp Industries's price has almost recovered whereas KepCop's price is still hovering below.  This is despite the broker houses and Analysts having given equal ratings as they gave the same to  SembCorp.

The main reason could be that KepCorp was more exposed to China.  As a result,  it has reported a deeper-than-expected drop in net profit for the year 2022.  Its net profit dropped to S$927 million ($709.91 million) for the year ended Dec. 31, from S$1.02 billion a year ago.  But its 1Q 2023 quarterly result was better than expected prompting many analysts to upgrade their ratings.

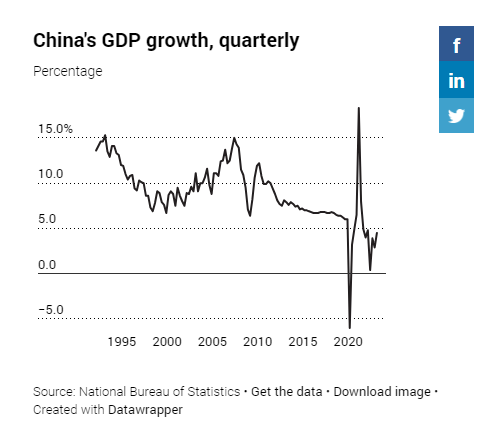
The market traders, however, have different views especially after it was reported that China's economic recovery rate was not as good as expected.   

Hence,  Going forward,  we do not expect KepCorp's prices to leap and bounce like SembCorp did unless KepCorp can reduce its exposure in China or China has improved its economic outlook in the coming months.

Disclaimer:  This article is for information and educational purposes.   Readers are advised to conduct their own research and study to make their own investment decisions.

Sunday, July 16, 2023

Singapore Airlines (SGX:C6L) Technical Analysis

16 July 2023


In the last post on 8 July 2023,  we said that the SIA price was forming another Flag.   This Flag2 has now been completed as shown in the following chart. 


If the SIA price can pierce through the top of the flag pole (colored green),  we might see the SIA price makes attempts to cover the candlestick gap created on 30 July.   


About the Candlestick Gap


When Temasek Holdings sold away 400 million shares on 30 July,  it created a candlestick gap with a price drop of S$0.35 or 5% as shown in the following chart


This gap is not only large but also has a trading volume of 85 million shares.  This share volume was about 13 times the average 100-day trading volume.   It is definitely a “runaway” candlestick gap.


According to the textbooks,   a “runaway” candlestick would usually take months or years to fill.   Those interested to know more about  runaway candlestick can find more detail here


Why are They Selling?


SIA has been performing rather well after the end of the pandemic.  In 2022,  It has posted the highest net profit in its entire 76 years of operation.   Some traders have expected the 1Q2023 earnings to be even higher.   Then why are the big players selling? 

Earlier on,  we posted that the broker houses and the analysts expected 

a)   A tapering in the number of air passengers,  leading to a decline in earnings.  

b)  The SIA to spend

 1) Billions to redeem the mandatory convertible bonds (MCB) they raised in March/April 2020.   

2)  A lot to renew its aircraft fleet, plus

c)   The SIA to allocate funds for the merger of the Vistara/Air India group. 

One other reason that has not been speculated so far is whether the SIA price has been running up too quickly too fast in 2023.

Is SIA Price Running Too Quickly Too Fast?

Presently, the World’s 5 best airlines in 2023 are

1.      Singapore Airline

2.      Qatar Airways

3.      ANA All Nippon Airways

4.      Emirates

5.      Japan Airlines

Except for Qatar Airways which is 100% Qatar Government owned,  the rest of the airlines are listed companies where we can compare their stock prices. 

It can be seen from the following chart and the table that SIA price has indeed been running way ahead among the airlines for the last 6 months in 2023.  Its price has more than  doubled the prices of other airlines


Going forward,  we would expect very strong resistance for the SIA price to break the top of Flag2.  It would be even harder for SIA shares to cover the candlestick gap unless the big players can reverse their earlier decision and decide to enter the market again.  Breaking up the resistances can only happen soon if the SIA's 1Q 2023 results to be announced on 27 July are so unbelievably good,  prompting players like Temasek Holding to regret and to buy back the SIA shares. 


8 July 2022

In the past week after Temasek Holding sold 400 million SIA shares and after 3 or 4 broker houses and analysts downgraded SIA had set a target price of S$6.80,  the SIA prices have been going strong as shown in this stock chart. 


We can clearly see that the market wasn’t ready to send SIA down immediately. The SIA prices have defied and made an attempt,  trying to recover from when the prices closed up from a one-month low of S$7.15 on 30 June to S$ 7.32.  The price gained about 2.3% for the week.

Isn't the Price going down to S$6.80?

No one can tell at the moment as this has not happened yet.  There is nothing concrete about the target price set by the broker houses/Analysts. The price could change due to traders' sentiment and prevailing news. Temasek Holdings can also make the price jump again for example. 

This technical chart is showing exactly the situation.  


The SIA price is presently raising its head above the trendline T1.  It is ready to head higher as long as it can stay above this trendline T1.  However,  we are spotting another bearish flag being formed.  It is marked as flag 2 This flag would take the SIA price higher to about  S$ 7.40 before touching the flag top and before deciding if it is going to go down again.


Can the Bearish Flag Pattern Fail?

There is nothing concrete about the result of any kind of analysis.  This is especially for stock Technical Analysis.  They can only be used for reference.  

Technical Analysis is only telling us that there is a possibility or there is a potential.  They cannot tell us about the minds of the traders and what they are going to do next. 

There are many examples one can find on the Net about how Technical Analysis had failed;  for example,  a bearish flag can turn out to be a bullish flag in the end.  

Here is one textbook example  This webpage is giving us some advice on how to spot a  bearish or bullish flag and how to trade when that happened.


How to Spot a Failed Flag Pattern?

The textbook has this to say:

A properly formed flag would have the following features:

1.   1.     Trading volume should increase just before the flag is formed;

2.   2.     Trading volume should then decrease while the flag is being formed;

3.   3.     The price should touch the top  of the pole for a bearish flag or vice versa to complete the flag;  finally and most importantly;

4.   4.     The volume must increase again when the price breaks the lower flag pole for a bearish flag or the upper flag pole for a bullish flag.

The SIA price pattern fits exactly these descriptions for a bearish flag to be formed.

Going forward,  traders are advised to be on alert and watch how the price form the bearish flag.


8 July 2023

Singapore Tourist Arrivals 2023

The tourist arrivals to Singapore were around 1.1 million for June 2023 as shown in the attached picture. This figure has been maintained over the last 3 months and doubled over the year as compared to 543,000 in June 2022.  The Singapore Tourism  Board (STB)  has predicted that Tourist Arrivals to Singapore would be in the range of 12 to 14 million in 2023.  To date,  tourist arrivals to Singapore have risen to 12.59 million,  which is an increase of about 586% YOY.


30 June 2023

Temasek Holdings Selling $400 million worth of SIA shares

This news about Temasek Holdings selling SIA shares has caused Singapore Airlines (SIA) share price to tumble and lost 4.76% or S$0.35 per share today.   It has also formed a glaring candlestick gap as shown in the following chart.


Temasek Holdings explained that it is always their routine "to reshape and rebalance their portfolio so that they can deliver sustainable returns over a longer term."  Temasek Holdings also said it would continue to be a significant shareholder in SIA with a 53.5 percent stake.

While some market investors and traders have taken this reason for granted and expected the SIA stock to return to its former shine,  many others were trying to understand why Temasek Holdings was selling those SIA shares especially when the SIA share prices were so bullish lately.

What are the Reasons to Sell?

The following reasons were speculated.  Temasek Holdings was:

1. Taking a profit;
2. Expecting a decline in the SIA’s earnings or
3. Diversifying and channeling profits for another business

The SIA Rights Issues

In March/April  2020,  Temasek Holdings took up about 986 million rights shares issued by SIA.   Then the right issue was S$3/=  per issue.   In addition,  Temasek Holdings has also taken up S$1.94 billion of mandatory convertible bonds (MCBs).

For this reason,  some netizens claimed that Temasek Holdings could earn a tidy profit of over S$1.8 billion by selling away 400 million shares.  But this reason could not hold water because Temasek Holdings' remaining 53.5 % stake would be severely affected by the stock sale.  Therefore,  the better reasons would be point (2)  or (3) with point (2) being more likely.  

The Brokers' and Analysts' Analysis

Some brokers and Analysts have turned more cautious lately about buying SIA shares.   They expected a tapering in the number of air passengers,  leading to a decline in earnings.   They also expected SIA to spend billions to redeem the mandatory convertible bonds (MCB) they raised in March/April 2020.  Furthermore,  SIA was also expected to spend a lot to renew its aircraft fleet plus they would have to allocate funds for the merger of the Vistara/Air India group. 

As a result,  many Brokers and Analysts have called to downgrade the ratings of  SIA stock.  For example,  PhillipCapital has reduced SIA's target price to S$6.80 while DBS has downgraded SIA to ‘hold’ with the same target price of $6.80.  POEM also reduced its ratings and  target price 

Example of what would happen?

A good and similar example is when Temasek Holdings sold about 3% or 62 million shares on 11 March 2012 or 12 years ago.  That stock sale reduced Temasek Holdings' stake in Sembcorp Marine Ltd (SM) (S51.SG) from 63.95% to 60.91%. Then SM's stock price was about S$3.05 (adjusted price).  The sale caused the price to drop 5% on the next trading day and a candlestick gap was formed as shown in the following chart.     This candlestick gap was covered within the next 2 weeks.  The price then fluctuated between S$2.30 and S$3.00 for the next 6 months.  It dropped by 7.7% in November when SM reported a 48% fall in the net profit for 2Q 2012.


What is the Takeaway?

In the SM example,  Temasek Holdings might have done its due diligence and found SM would have a bad 2Q report.  Temasek Holdings could reap a tidy profit of S$49 million without losing a single share if they were to buy and replenish back the 62 million shares after the 7.7% drop in November 2012.  


Would the SM's example repeat in SIA?

The example might be repeated in SIA.   In fact,  it could be repeated again and again anywhere. 

Let's examine the SIA's stock chart closely.  The chart is showing that SIA stock has formed a bearish flag as marked in red.   This flag has a target price of S$6.86 according to the technical books.  And this S$6.86 also happened to be a strong "technical support" for the SIA stock.  It is also the target prices of the 3 brokers/Analysts that were quoted earlier.   Like the SM example, the SIA price might have a leg down to find solid support at around S $ 6.80.   It is also very likely the candlestick gap formed today would be filled sooner or later.


Whether the SIA would have a bad 2Q or the 3Q report in 2023 like SM in 2012 would be anybody's guess.   But it would be advisable for investors to be cautious and do the necessary due diligence before buying or loading more SIA shares.
 
Disclaimer:  This article is for information and educational purposes.   Readers are advised to conduct their own research and study to make their own investment decisions.

Tuesday, July 11, 2023

ISDN

10 July 2023

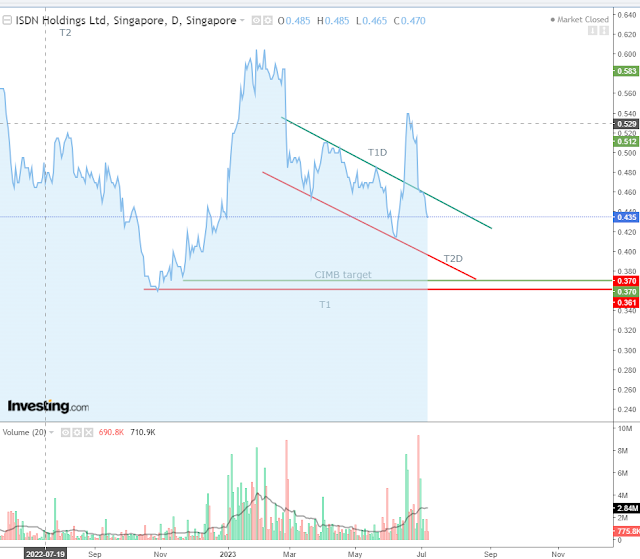
CGS-CIMB,  a broker house in Singapore downgraded ISDN to 'reduce' holding on 27 June 2023 They gave a target price of S$0.37.   This target price is about 32% lower than the highest closing price of S$55 on 20 June.  They were of the view that China's performance will be weak in the coming months.   An excerpt of the  CIMB report can be found here.  It was also summarised in this article.


According to TradingView,   ISDN derived about 65% of its revenue from China as shown in the following graph.


As a result, ISDN's share price dropped  9.7% or S$ 0.05 from S$0.515 to 
S$0.465 on 28 June.  It then dropped for the next few trading days to close at S$0.435 on 7 June,  about 15% down since the day the counter was downgraded.  The price dropped further on poor market sentiment and ended with a price of S$4.35 on 10 July 2023,  about 20% down from its recent peak on 20 June 2023.

A question remains as to whether ISDN would go as low as S$ 0.37 as predicted by CGS-CIMB or it would bound and recover quickly from this nasty fall.

About ISDN

ISDN Holdings Ltd is a Singapore company specializing in the provision of automation solutions and services ranging from precision components and engineering services.  It provides also specialized Engineering Solutions, Industrial Computing Solutions, and Other services. Off late,  it has ventured into renewable energy solutions.  A mini-hydro power plant (10 MW) in Lau Biang,  Indonesia was completed and commissioned in December 2022.   Recently,  it said it has obtained permission to commission another  2 mini-hydropower plants in Anggoci (10 MW) and Sisira (4.6 MW),  Indonesia.  Earlier on,  it has associated with a firm called AEnergy which has operated a few hydropower plants elsewhere in Indonesia   Presently,  the ISDN is still holding about 67% of the stocks in AEnergy according to the 2022 annual report.


About Hydro Power Plant 

For those who are not familiar with Hydro Power Plant,  here is one good article to read.  In short,  hydropower can provide a  low-cost electricity and green solution as compared to other sources of energy.

Can Hydro Power Help the Bottom Line?

The answer is definitely a yes.  

When the ISDN's first hydropower project in Lau Biang was completed and in operation during December 2022,  ISDN claimed that this Lau Biang plant would add about 18.5% to the group earnings based on  2022 earnings.  This earning is worked out to be around S$2.5 million per year based on the S$15 million annual earnings reported on  February 2023.   The Lau Biang plant is 10 MW and the 2 extra plants in Anggoci and Sisira will add another 14.6 MW.  

By mathematical proportion,  It is estimated that the 3 plants will add another S$5 million per year toward the earnings of ISDN.  But, there is always a "but" for reasons to be explained.

Reasons

1.   Hydro Power Plant constructions are Capital Intensive
 
Hydro Power Plants are cost-effective projects but a worthwhile investment.  It unit cost of development is more than  US$2000 per KW.  This is almost twice as much as compared to the fossil fuel power plant.     

In the US and in other countries where electricity tariff is moderately high,  the hydropower plants would have an internal rate of return (IRR) of more than 14%.  The payback period is usually within 10 years.  But in Indonesia where the electricity tariff is kept low.  around US$0.09 per Kwh, the internal rate of return (IRR) is usually less than 10% and the payback period could exceed 10 years.

2.  There are certain risks in hydropower plant investment in Indonesia

a)  The Government could change the policies under political pressure.  Not too long ago in 2020, they put a capacity cap on how much hydropower plants can generate and they buy the excess power only at half price.

b)  The power generated is assumed to be sold PLN, the local electricity board.  PLN has a Power Purchase Agreement (PPA) that could restrict the sale and change the selling price.  This selling price is generally about 85% of the tariff.


Technical Analysis

Technically,  we are seeing ISDN trapped in a downward channel which is supposed to be bullish going ahead when the price can break the resistance trendline T1.  The CIMB target price of S$0.37 is very close to the support at S1 according to the following weekly chart.


If we zero into the daily chart,  we could see that the ISDN price is bouncing between the channel labeled T1D and T2D at the moment.  It has broken up but was forced back into the channel by the CIMB price downgrade.

Going ahead,  we are expected to see the price to stay within the channel.   For information,  T2D,  marked in red,  is one very strong support;  breaking it can cause volatile trades.  if this T2D support is broken, the ISDN price will want to test the support S1 as shown in the above weekly chart.


The Candlestick Gap 

There are 2 candlestick gaps spotted in the ISDN chart.  One happened to be on 27 February 2023 and the other,  recently, on 28 June 2023.  

The one on 27 Feb was created by the ISDN's report about a 42% falls in the annual net profit;  the one on 28 June  was caused by downgrades from CIMB.


On both occasions, the trading volume on the day was over 5 times the 100-day average daily volume.  This volume is significantly large.   

According to some textbooks, they can be classified as runaway gaps.  It might take months or years to fill.  

As these gaps are earning-related, the gaps could be filled if ISDN can produce a good earning report to convince the investors.  The next half yearly result would be around September 2023. Hopefully by then, there will be good earning news. 


Wednesday, July 5, 2023

Put/Call Ratio As an Trading Indicator

4 July 2023

Put/Call Options in the US market have been used by investors to hedge their investments in equity and other markets. For example,  when investors invest heavily in stocks,  they might want to buy some put options to mitigate their risks and vice versa.   Because of this purpose,  we often see call-and-put options being used to chart the market direction.  

We can find the daily trading of Put/Call options in the Chicago Board Options Exchange (CBOE).  This is their webpage.  We can also find many websites giving free Put/Call Ratio charts;  for example, this chart is in StockChart.


Unfortunately,  these charts are only able to tell us the present and not the future trend.  For example,  the above chart is telling us that the equity market is getting stronger because the Put/Call ratio is trending slightly downward.  It cannot tell us if this trend will continue.

Trending the Future

To look at the future trend,  we should expand the chart as shown.  We could clearly see the trend from the following chart: 

The Chart is now able to tell us not only the present trend but also the trend in the coming future.   It can also tell us roughly when to buy and hold or when to sell the equity.

For added clarity,  we could remove the daily wiggling line and then add in the 20,  50, and 200-day moving averages (MA) as shown in the following chart.  This new chart will tell when to buy or sell.  That is,  we should start to buy when the 20 and 50 MA is staying consistently below the 200 MA;  otherwise,  we should start to sell.   

The most rewarding time is when the 200-day moving average is trending downward like in early 2020.


Disclaimer:  This article is for information and educational purposes.   Readers are advised to conduct their own research and study to make their own investment decisions.


iPhone and iPad: How to Create a Short Cut in Home Screen to Clear Cache & History

23 November 2024 What are Cache and History? Cache and browser history store information about websites you've visited.  The C ache s to...