Search This Blog

Friday, May 29, 2009

Quick Fix for IPOD error “Firewire Connection Not Supported

29 May 2009

Introduction
Many IPOD members had this to say: “I was getting this error and I tried all things without luck. I got another new iPod and within a month it started giving me this same error "Firewire Connection Not Suported...". Pressing the center button makes it go away for less than 1 second and it scrolls right back again. I can't select songs, turn it off, or anything! Nice paperweight right now. I am going to be one dissatisfied iPod owner “

What Happened?Dirty IPOD connector. Very often we neglect to look after the IPOD cables and its connectors. The cables are often left idling around and the connectors exposed to the air without any cover. They will accumulate dusts and this dusts will be transferred to the IPOD’s blades of connector. Over time and with enough moisture, these dusts will turn into dirts and cause a connection between the blades of connection. Somehow, the IPOD detects this as an attempt to connect the IPOD via the firewire.

Tools Requireda) WD 40
b) Tooth pick
b) Cotton wool

Method
1. Spray some WD 40 directly into the window of the connector as shown and wait for a few minutes;


2. Put some cotton wool and row it onto the tooth pick and make attempts to clean up the blades of the IPOD; repray some WD 40 into the window;
3. Reset the IPOD if needed be and the “Apple” screen should reappear without the error. If not, retry step 1 & 2.
4. Clean up the residual of WD 40.

Wednesday, April 15, 2009

Common Network Problem - Limited Connectivity

15 April 2009

IntroductionEvery now and then, one would receive error message in the task bar saying one's network has limited connectivity or no connectivity. Very often, fixing the known bug in SP2 and clearing and resetting the TCP/IP stack etc just do not work. Then it may be worth the while to fix it by resetting the modem and also, re-installing the network drivers.


What could have happened?
Devices such as network controller are often assigned an Interrupt Request(IRQ) by the system during start-up. Because there are limited numbers of IRQ, many devices would have to share the same IRQ. Most computers nowadays are ACPI compliance. The ACPI will assign these IRQs during start up according to its default settings. It may cause competitive use of the IRQs and corrupt device drivers. If that being the case, the only fix is to re-install the driver. It is necessary also to resolve the IRQ conflicts to fix the problem permanently.


How to Confirm the Problem is not caused by ISP ?It is always good to check the connection using another PC or noteb0ok just to confirm that the problem is related to the computer.
It is also good to take the opportunity to reset the modem to ensure that it has been reloaded to default setting or the manufacturer's setting. To reset the modem, one often need only to turn-off the modem, wait a few seconds and re-connect the modem again.


How to Re-install the Network Driver?
1) Bing up the device manager
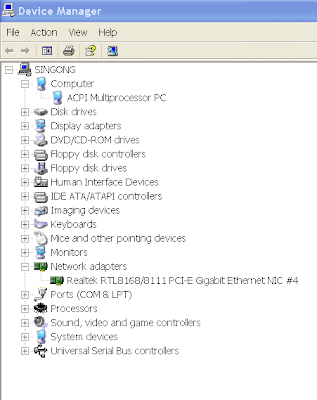
Click start, then run. In the dropdown box, enter "devmgmt.msc" (without quote). One could also start up Device Manager using the Control Panel. The following Device Manager screen should appear.


Look for the "Network Adaptor", expand it and then double click the network device to bring up property screen. When in the property screen, select the driver tab and click the "Uninstall" button to remove the network driver.
2) Re-start the computer.
If the network driver is still in the window system folder, the computer will find it and prompt user to re-install the network driver during start-up. However, in case the computer cannot find the driver or the driver in the window system has been corrupted, one would have to re-install the driver using the motherboard disk that come with the computer.

Monday, April 13, 2009

COPPOCK Indicator: When to Enter or Leave the Market

13 April 2009

What is COPPOCK indicator?

The Coppock curve or Coppock indicator is a technical analysis indicator created by Edwin Coppock, first published in Barron's Magazine in 1962.
Edwin Coppock developed the Coppock Indicator with one sole purpose: to identify the commencement of bull markets. The indicator was devised for use on S&P 500 but is suitable for use on other market indices or averages.

How COPPOCK Indicator is Calculated?

The indicator uses a monthly time scale. It's the sum of a 14-month rate of change and 11-month rate of change, smoothed by a 10-period weighted moving average;

In formula:
COPPOCK= WMA[10] of (ROC(14)+ROC(11))

and in words:
1. Calculate the 14 month Rate of Change (of Monthly Price) for the index.
2. Calculate the 11 month Rate of Change (of Monthly Price) for the index. 3. Add the results of 1 and 2.
4. Calculate the 10 month weighted average of the results

Where Can I Find This Indicator For STI and DOW?

There is no known source that can give updates for COPPOCK indicator on STI and DOW. However, it is not too difficult to build this indicator in the metastock or similar kind of software using the following formula:

Mov((ROC(C,14,%)+ROC(C,11,%)),10,W)/100 (shown red in attached charts)

Another formula to express COPPOCK in smoothened mode

(Mov(ROC(Mov(C,14,S),11,%),10,E))/100 (shown blue in attached charts)

Interpretation of COPPOCK Curve

When the indicator was published in Barron’s (1962), it was suggested one should enter the market only when Coppock Curve started to reverse from an extreme low.
However, one will notice that market will reverse its trend whenever COPPOCK curve reverses from its extreme low or extreme high.

Other observations are:
a) The first COPPOCK reversal from extreme low is often followed by the highest COPPOCK reading (highest momentum); subsequent ones are usually followed by lower peak COPPOCK readings, indicating weakening or aging market.
b) The market will rise when the COPPOCK crosses above the COPPOCK smoothen curve; otherwise, the market will fall.

Best Time To Enter the Market?

According to the original interpretation, the best time to enter the market is when the COPPOCK curve (red) reverses from its extreme low. The DOW's COPPOCK curve is now suggesting that it is still not the right time to enter the market.

As for STI, the picture is about the same.

However, it is suggested that one should not just rely on one or two indicators to decide when to buy, sell, enter or leave the market. COPPOCK indicator may have given the correct signals so far but that does not always mean that COPPOCK curve will be able to give a precise timing.

Application of COPPOCK in Other Charts


COPPOCK suggested to use monthly charts for his COPPOCK curve. Many Analysts have attempted to use it for charts of different time scales such as weekly time frame.

UPDATED :  14 April 2009 & 15 April 2009


If one were to study the above DOW's weekly COPPOCK curve carefully, one could find that DOW will always rise when the red curve (COPPOCK) cross above the blue curve (the smoothened curve); similarly, the market will always fall when it crosses under.    The above chart shows clearly that the COPPOCK has a signal to enter the market on 21 Nov 08 (red curve about to cross blue cure);  however,  this did not happen and the market continued its fall until March 09.  

Update :  1 August 2018
If one has faithfully followed the coppock curve to invest in stock market,  one could reap a lot of profit by now.   For long term investors,  it will be simple just to use monthly chart to decide when to enter and when to leave the market as illustrated in the following chart

The above chart indicated that it is definitely not the right time for long term investors who have reaped all the earlier profit to give up and empty all  their holdings  without first checking the coppock curve in the weekly chart and also consulting other technical indicators.   However,  one would not expect the  stock market price to gain much i.e. not until coppock curve begins to turn up and move in the opposite direction.

-------------------------------------------------------------------------------------------------------------------
Other stock articles

Tinyurl : https://tinyurl.com/yat3mnkw 

Disclaimer:
Information here is for sharing and learning. It is not intended to give any advice on any stock or movement or trend of any index. If a price or movement of a stock/index is given, it is only intended for illustration. The reader shall verify the information given here before using them.

Saturday, January 24, 2009

DOW May be Trapped inside a Channel

24 January 2008

IntroductionAfter having broken the support of the bearish rising wedge, DOW continued to edge lower, hugging against the lower Bollinger Band. It was in dangerous and critical condition when DOW's ADX rose above 20, where tradings would become more and more volatile. However, DOW was able to resist the selling pressures thus far and rebounced at the end of the last few trading sessions with relatively higher trading volume. It may be because DOW has found another support in an Ascending Channel.

What is an Ascending Channel?
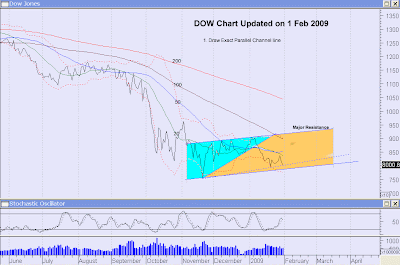
An ascending channel is a set of upward sloping parallel lines that restrict the price/index movement as shown in the attached. Price/index may not always be within the parallel channel lines that show the support and resistance for price/index targets. A breakout above the upper channel line can signal continuation of an upward movement whereas a breakout below the lower channel line can signal a trend change.

Abnormal BehaviourUsually when a stock or index hugs and expands the lower bollinger band with ADX above 20, the tradings will not only be volatile but also brutal with daily falls expected to be more than 1%. However, DOW's behaviour in the last few sessions was quite abnormal. Instead of going down sharply as it should be, DOW was building up its resistances, showing bullish long tailed candlesticks with trading volumes above the norms. Such behaviour usually suggest that a support has been found and this could be the trendline shown blue in the attached.


click for enlarged view

This blue line together with the former major resistance line shown red in attached could suggest that DOW could be trapped in an ascending channel.

How about STI and Hang Seng?The following charts suggest that STI and Hang Seng, which often track the movement of DOW, are showing similar resiliency and are trapped also in the ascending channel.

Trading StrategyIf one has no vested interest in stock or equity or index market, it will be good to wait for the confirmation that DOW is:

a) Not breaking the lower channel line;
b) rebouncing from this lower channel line with ADX changing its direction from going up to going down. For those who are vested and are preparing to ride through the "storm", it is good to watch that DOW will not break the final support @ 7,500 or to buy Put Warrants to hedge for the expected losses to be incurred.

1 Feb 2009 Update :
DOW rebounced but failed to break above the 20-day moving average. It is now sitting on a supporting trendline which was inadvertently shown as the lower channel line in the last posting. The updated chart will show that if this supporting trendline is broken, DOW may found support at the lower channel line. It will want to retest the low of 7,997 on 20 Nov 2008 when this lower channel line is broken.

It is quite likely that DOW would rebounce if the Obama's $825 bln stimulus package is passed by the Senate next week.


click for enlarged view

19 Feb 2009 Update:

The Obama stimulus package did not help to boost the market; instead, DOW broke away from the rising channel. It dipped 1.19% to a new low of 7,465 which is just below the November 2008's low of 7,552. It would appear that DOW had just formed another bearish flag, which would suggest 5,500 as the next target unless DOW could regain and reclaim its November 2008's low convincingly. DOW's present position is quite similar to the one in June 2008 as shown in the following graph.

click for enlarged view

18 April 2009DOW found itself trapped in another channel after Feb 2009 as shown in the attached weekly chart. This time a bullish declining channel. DOW appears to have a bullish look with the following observations:
a) It has just cleared the bullish declining channel;
b) It has recovered the last break of the "bear flag" line (as shown red in attached chart);
c) It has also cleared 20-week average and now is sitting above it;
DOW is believed to be heading for the resistance line, originated from Sept 2008; then, it will test the upper Bollinger line.
However, there are dangers signs around, signified by the falling 50 and 100 week averages. The 100-week average, which is about the cut under the 200-week average, appears to have a dangerous look.
The COPPOCK indicator suggested that the present market is still a trader's market and not a start of a bull market where long term investor can safely enter the market.
Disclaimer:
Information here is for sharing and learning. It is not intended to give any advice on any stock or movement or trend of any index. If a price or movement of a stock/index is given, it is only intended for illustration. The reader shall verify the information given here before using them.



Thursday, January 15, 2009

DOW in Dangerous But Not Critical Condition

15 January 2008

IntroductionLast night, DOW lose about 250 points or 3% and fell from 8,448 to about 8,200. DOW is now in dangerous but not in critical condition. This is because the ADX has just reversed its direction but stayed below 20.


What's ADX?ADX is a acronym for Directional Movement Index, which is another very important index in Technical Analysis. ADX will tell the direction in the movement of a stock or index. When ADX is moving down and suddenly reversing its direction to move up or vice versa, it signifies a directional change in the movement of stock or index. One would expect the stock/index to move up or down depending on the changes. If ADX moves above 20, it usually signifies an accelerated movement and when it it moves above 30, the acceleration will intensify.

The following Chart A will illustrate with red circle identifying the up movement and blue circle identifying the down movement.


Why Dangerous and Not Critical?Earlier on, DOW formed many shapes and patterns. It finally selected the bearish one which is the rising wedge pattern. It then broke the supporting trendline that has been restricting DOW's movement since November 2008. Subsequently, it broke the 20-day as well the 50-day supports and presently hugs the lower Bollinger band with ADX changing its direction as shown in attached Chart B. This put DOW in a very dangerous position. However, the Bollinger band has only been expanded slightly and ADX is below the 20 critical line with the 10-day Stochastic chart in oversold region, these indications suggested that DOW was not be in a critical condition.

Trading Strategy?If one has no vested interest in stock or equity or index market, it will be good to stay sideline until the situation has improved. For those with vested interest, it would be advisable to set targets for loss cutting or prepare to buy Put Warrants to hedge or compensate for the expected losses to be incurred should there be a serious downfall in stock market. Invariably, there will investors who would want to take the chance to short sell the market or go bargain hunting during this period.

Disclaimer:
Information here is for sharing and learning. It is not intended to give any advice on any stock or movement or trend of any index. If a price or movment of a stock/index is given, it is only intended for illustration. The reader shall verify the information given here before using them.

Saturday, January 3, 2009

DOW Has Formed Many Shapes and Patterns

2 January 2009

Introduction
DOW re-bounced from its low of 7,552 on 20 Nov 2008 to the present high of 9,034 on 2 Jan 2009. It has gained about 1,500 points or 20% over a period of slightly over 1 month. It has moved up against the odd of many bad economic news.

Where will it move from here?
According to Chinese Zodiac, the next Chinese New Year is an OX year. It was speculated that years of OX were never a good year for equity or stock market. This has proven to be true for year 1973, 1985 and 1997 when markets plunged during these dreadful years.

Will it be true also this year?
Charts are not able to tell much about the distant future. However, the chart of Elliot Wave indicates that DOW is presently forming the "ABC waves". The Elliot Wave chart suggested that DOW could have just completed forming its downward "A wave" and presently, it could be forming the "B wave" as shown in the attached monthly chart:


The above chart also shows that DOW tested the 200 MA support line recently. If this important support line is broken, then one would expect DOW to extend its wave A movement and seek lower lows.

Can the Charts Read the Near Future Movement?
The following charts will show that DOW is presently negotiating a re-bounce and is forming all sort of shapes and patterns. It gave conflicting signals about its near future movements.

Although most of the signals are positive ones, there is one worrying signal that indicates that DOW will continue its decline as shown in the attached chart:

Photobucket

doubleclick for enlarged view

The above chart shows that DOW has formed 4 different shapes and patterns. They are:
a) The bottom Head and Shoulder pattern (bullish);
b) The ascending triangle(bullish);
c) The symmetrical triangle(bullish);
d) The rising wedge(bearish).

It is good also to note that:
a) DOW had broken the resistances of some of these shapes and patterns;
b) Its 20-day MA was about to cross over the 50-day MA;
c) The trading volume was low when DOW broke the resistances.

Isn't That Bullish?
By popular count, one can say that DOW is bullish presently; however, the trading volumes were quite low when DOW broke the resistances plus there were many bad news, one could not conclude that DOW will continue its way up; on the contrary, DOW may just turn bearish and continue its way down.

How's STI Doing?
With the 68 point gained last Friday, STI has broken the symmetrical triangle that has restricted the STI's movement over the past 3 months; again, this significant event was not supported by very heavy trading volume. It could mean that the investors were still doubtful about the STI's future movement.

Trading Strategy
Unless there is a trading breakout supported by heavy trading volume in the next few sessions, it is likely that STI or DOW will remain range bounced with a sideway movement or may even dip from the presently level.

It is therefore wise to remain cautiously optimistic until the 20-day MA can cross over the 50-day MA convincingly or when there is a trading breakouts supported by heavier trading volume.

Disclaimer:
Information here is for sharing and learning. It is not intended to give any advice on any stock or movement or trend of any index. If a price or movment of a stock/index is given, it is only intended for illustration. The reader shall verify the information given here before using them.

Saturday, December 27, 2008

Monitoring Hard Disk Conditions

29 December 2008

Introduction
Very often, one faces the problem of computer failing to start up; sometimes, the computer just hanged and may even re-start itself before it reaches the usual welcoming start up screen. Besides a virus that can cause such problem, the harddisk's condition could just be another one of such causes.

Can We Prevent Harddisk Failure?
Harddisk failure is either caused by component failures due to electric surges or by damaged harddisk media due to normal fair wear and tear. The latter appears to be main cause of all problems. One of the many ways that we can prevent a harddisk failure is to monitor the harddisk's working condition, especially its operating temperature.

How to Monitor?One can download this S.M.A.R.T software free from here.

What is S.M.A.R.T?It stands for "Self-Monitoring, Analysis, and Reporting Technology", first introduced by IBM in 1992. S.M.A.R.T will monitor about 40 different attributes of the harddisk from read and seek errors to airflow temperature in and around the harddisk.

How useful?Among the many attributes monitored, one would find the temperature monitoring most useful. Very often, one neglects the proper ventilation of the harddisk. This S.M.A.R.T software can continuously monitor the temperature and warns us if the temperature has exceeded the preset level. This would often prevent premature harddisk failures.

Besides temperature monitoring , the software can scan harddisk surface and display the results in graphs. This will facilitate the repair and the revival the harddisk. The software could also point out the data transfer errors caused by faulty cables etc.


Doubleclick for enlarged view
How to install?The HDDScan software to be download comes with installation readme notes as well as manuals for the installation and operation of the software. There are no complicated installation procedures other than having to extract the ZIP files into a selected directory.

Related articles
1. S.M.A.R.T. Wikipedia, the free encyclopedia
2. HDDScan, the HDDGuru

Friday, December 26, 2008

A Period of Indecision in STI

26 December 2008

IntroductionOne will heard endless arguments about where STI will move in the coming weeks. Some will say that a plunge is imminent while others will disagree. This is all because STI has entered a period of indecision.

Progress Todate
STI has plunged more than 54% since October 2007. It has just recovered about 8% or 130 points from its low at 1,613 on 20 November 2008. It has been moving sideway ever since and is presently trapped in a symmetrical triangle formation as shown in the attached graph.
doubleclick for enlarged view
Going Forward
Presently, US has been reporting very poor economy figures; the Singapore's economy figures are not any good either. Many analysts, including Mr. Daryl Guppy, had projected selling pressures in STI although they were not too sure of the exact market movement next because of the symmetrical triangle being formed in the STI's chart.

Mr. Guppy had 2,300 on the upside and 1,250 on the downside.
What the Chart is Telling Us?
The above daily chart shows the symmetrical triangle that Daryl Guppy has mentioned. The chart is also telling us that:

Bearish looks:
a) STI has formed another bear flag with its based at 1,600;
b) It tried twice recently but failed to break the upper triangle trendline
Bullish looksa) Its 20-day MA is rising and the 50-day MA, flattening out; the 20-day MA is about the cross the 50-day MA;
b) It's Stochastic has reached the oversold region.
Neutral looksa) It's volume is thinning out as it goes sideways or slightly lower;
Future MovementsThe chart also tells us the future movement; for example:

a) Heading lower when the lower trendline of the symmetrical triangle is broken.
If the last low of 1,600 support is also broken, STI will want to target for 1,250, which is the equal length measured from the 1,600 base of the flag pole to its last high. If this target of 1,250 is broken again, the next target is likely to be around 1,050.
b) Heading higher when the upper trendline is broken.
If the top of the Bollinger Band (shown dotted in red) is broken, it will want to target for the 100-day MA line. Next, it will target for the 200-day MA line which happens to be the trendline of the peak since October 2008 (shown blue in the chart)
However, for both events to happen, there must be also a surge in the trading volume; otherwise, STI might just continue its sideway movement, much like the breakout of the triangle on 9 December 2008 (shown dotted in blue)
Disclaimer:
Information here is for sharing and learning. It is not intended to give any advice on any stock or movement or trend of any index. If a price or movment of a stock/index is given, it is only intended for illustration. The reader shall verify the information given here before using them.

Saturday, December 20, 2008

How to Revive Faulty Hard Disk

20 December 2008

Introduction
There are many reasons why computer always hang or run slowly or sometimes, even re-start itself. One of reasons can be traced to the harddisk failure. Normally, one would repair the harddisk by recovering the bad sectors using "Chkdsk" in the "Windows Recovery Console". However, there will be times that even this method won’t help. This article will describe another method to revive that harddisk.

How Long the Harddisk will last After the Revival?
It will depend on the condition of the harddisk. If the harddisk had a crash, there is a good chance that the harddisk will not last too long before it will fail again. Therefore, it is good to make a safe copy of the important data in the harddisk whenever possible.

Harddrives are quite cheap nowaday; it will make good sense to replace rather than to repair or revive them. But if one had decided to give the revival a try, this article will describe one method.

What’s needed?
1. Low Level format software (free to download from here)
2. Partitioning software such as Partition Magic or equivalent

Step by Step Procedures

Using PartitionMagic

a) Non Destructive Method
This method will make use of the PartitionMagic to create a new partition to isolate the bad section and to use the healthy part of the harddisk.

The method will retain most of the applications and programs in the harddisk. One might have to perform a low level format describe in Section (b) when there are too many bad sectors in the harddisk.

1. Estimate where to create this partition
When performing "Chkdsk" operation, observe the progress counter and note down its percentage when Chkdsk got stuck. The following example will assume that the counter got stuck at 75% while checking D: drive.

2. Start up PartitionMagic
One would be greeted by this screen that shows all the partitions in the harddisk.


3. Create New Partition
Select to “create new partition” in the “Wizard” and after answering a few questions about how to use new partition and the type of file system, one would come to the following screen where one would have to specify the location for the new partition.

Since the Chkdsk counter was stuck at 75% when scanning D: drive and D: has 50 GB, one would like to create a new partition between D: drive and E: drive and take about 35-40% off from D: drive to make this new partition. One might have to release some space in D: drive if it is full. New partition can only be created from free and unused disk space.
In case when error is encountered during the process of creating a new partition, either try to resize or erase the new partition, then assign a smaller size of partition to isolate the faulty session,


Click “Finish” and subsequently, click “Apply Change” to make the changes. Thereafter, format the entire disk so that a drive number can be assigned to the new partition just created.
 

4. Check For Errors

Check the various partitions for errors using the utility programs available under the “operation” menu of the PartitionMagic. Resize the new partition and recheck for error if necessary.

(Note: The above example assumed that the harddisk is still working with some errors in one section. If the faulty harddisk cannot start properly, one would have to hook the harddisk as a slave. The latter is always recommended because one might have to tweak the size of the new partition to locate the faulty section and it would save the trouble of re-starting the computer to change the partition sizes)

Other Tools (Updated 1 May 2021)

MiniTool Partition

1.  Download free software from here

2.  Similar to MagicPartition,  this MiniTool software can also perform the same tasks.  The paid versions can also backup & recover data

b) Destructive Method: Low Level Format
When there are too many bad sectors or faulty sections in the harddisk, it is always good to backup the important data and perform a low level formatting. This low level formatting will always require the faulty drive to be hooked up as a slave drive.

1. Download the low level format program from here.

2. After installation, run “LLFTOOL.EXE” and follow the instruction to select the faulty drive and then select low level format page.

Double confirm the correct faulty drive before you press the button “FORMAT THIS DEVICE” because all data in the drive will be erased and gone permanently.

3. Create new partitions and reformat the harddisk as if it is a new harddisk
4. Reinstall operating system and the rest of the applications/software
Note: If one still encounters problem, one can go through the Section (a) again to isolate the faulty sections.
Related Articles
1. Repair Damage Master Boot Record & Boot Sectors
2. Replacing the Hard Disk

Thursday, December 18, 2008

VIX, DOW and Market Movement

18 December 2008

IntroductionThe Volatility Index, commonly known as VIX, is a Futures stock index traded in the Chicago Stock Exchange. It is often referred to as the barometer of investors’ confidence in equity market. It indicates the investor sentiment and market volatility. A higher VIX will indicate a lower DOW and vice versa.

What happened to VIX lately?
The attached chart shows that VIX was having very volatile trades lately; it climbed from $20 on 1 Sept 2008 to $80 on 27 October 2008, a hefty $ 60/= or 300% jump, which had never been seen before since 1993 when VIX was first introduced. Then it made a double top formation and plunged 40% to the present level of about $50 through volatile trades.


(Doubleclick for larger view)

What's the use of VIX?
VIX has volatile trades; hence, it is good gauge to judge the movement of the equity markets, which usually have less volatile trades that make future prediction difficult.

Where Can I Get Free Quotes?One can get free quote of VIX from here and DOW from here.
Where is VIX Heading?
The attached chart shows many weaknesses of VIX; for example:

a) It has just formed a double top formation and is presently declining from its second peak;
b) It's 20 MA (green) is about to cross under the 50 MA(blue), meaning VIX is about to start its decline;
c) The top and bottom Bollinger bands are falling together with falling 20 MA and flattening 50 MA;
d) The stochastic is showing a “falling peak” with VIX dropping steadily into the oversold region. There are still rooms for further declines.

The above weaknesses will show that VIX is presently under heavy selling pressure. One should soon see VIX started to yield once it crosses below the double top support (red) at around $48.

According to rule of thumb, once VIX crosses under the double top support, it will target for $15, which a projection from the base double top support, using equal length measured from the tip of the double top to the base support.

Where would DOW be then?
There is no direct co-relationship between DOW's and VIX’s movement. But if there is any indication at all, DOW will move up when VIX is moving down. However, if the projection of VIX is correct with a target of $15, DOW may be targeting around or max out at 13,000. But to reach that level, DOW would have to break several resistances including the one at 200 MA, which could be a "tough nut to crack" unless DOW is supported by very good news and economy figures.

Disclaimer:
Information here is for sharing and learning. It is not intended to give any advice on any stock or movement or trend of any index. If a price or movment of a stock/index is given, it is only intended for illustration. The reader shall verify the information given here before using them.

iPhone and iPad: How to Create a Short Cut in Home Screen to Clear Cache & History

23 November 2024 What are Cache and History? Cache and browser history store information about websites you've visited.  The C ache s to...