Search This Blog

Saturday, February 9, 2013

How to Regain Disk Storage Space in Windows 7

9 February 2013 

Introduction

The Windows 7 operating system will use a lot of disk storage  for system protection without the users knowing it.  These storage are often hidden away and fully protected from accidental deletion. At times,  a single file can take up as large as 30GB. This article will present a way on how to delete these system protected files and reclaim the disk storage space.

Why Big Files?

Depending on one's Windows usage and how often one installs new programs or create a restore point and how one limits the storage capacity,  the system restore files can add on the new and existing  restore points and can accumulate to quite a sizable file.  Sometimes,  the system restore files may be corrupted and new ones are added on without any mean of deleting the corrupted ones using the normal deleting function provided in system restore.


How to find these files?


 To find and view these files,  one has to unhidden them in the Folder view.  

  1. Select [Computer] from [Start] button;
  2. Select the drive to search the files;
  3. Tap [Alt] button  and a file menu will show up;
  4. Select [Folder option] under [Tools]  and then select [View] tab.  The following picture will appear
5.   Select [show hidden files,  folders, and drives] and uncheck the [Hide protected operating system files] and click [ok].  The File Manager will reappear.

6.    In the top right hand corner,  click the [search xxx] box and select [size] and then [gigantic];  a list of files in drive xxx will be shown.

Can one safely deleted the files?


Most system protected files are not safe to be deleted unless one knows what are they;  however,  one can always delete unwanted system restore file as one can always reconstruct these files. One can always test to see if the system restore file will increase in value when one create a new restore point.  In these case,  a system restore file has choked up about 29 GB of space under the [system volume information] folder.


Why such a big file? 


A system restore file is usually about a few gigabyte.  It would increase as one add on more restore points;  sometimes,  the restore points are simply added on uncontrollably by software.  Once written,  it remains there until it is deleted. Other times, these files are just added to the old and existing ones without showing up the names in any system restore pages. 

How to delete these protected files? 


As these are system protected files, the system will not allow any tampering by any windows base operating system such as BARTPE or mini Windows XP etc  even though they are  booted from an external disk drives.  The only way is to delete them by using a separate operating system such as Unix or Linux system.  In this case,  the author has chosen to use KNOPPIX which is an GUI LINUX system.  The free copies of KNOPPIX can be downloaded from here.  Once KNOPPIX is loaded,  navigate in the following 3 steps :
1. first selecting the [File Manager];
2. followed by selecting the [detailed list view] and then
3. select and right click the file to delete it.


 Finalizing 


After logging out from KNOPPIX and booting back into Windows 7,  one should quickly go to the system restore section and make a fresh copy of system restore file.

Tuesday, January 8, 2013

Analysing DOW's Last Bullish Engulfing Pattern

8 January 2013

Introduction


Last Engulfing pattern is an interesting pattern occurring frequently in stocks and equity market.  Able to identify reversal of such pattern can let one reaps profit in stock markets.

What is Last Engulfing Pattern?

Last Engulfing pattern (LEP) occurs when engulfing pattern appears at the top of a rising trend or at the bottom of the falling trend.   The former is often called the Last Bullish Engulfing or Last Engulfing Top and  the latter,  the Last Bearish Engulfing or Last Engulfing Bottom.  Last Bullish Engulfing and Last Bearish Engulfing were spotted for Olam's stock recently


Has LEP Ocurred in DOW and Indexes?

LEPs are often spotted in DOW and other indexes.  There were altogether 34 Last Engulfing Top found in DOW since 2007.  The last was spotted just 2 days ago.


Are LEPs Reversal Patterns?

As can be seen from the above chart,  LEPs are not necessary reversal patterns.  TextBooks differ in views.  Some even testified that LEPs were continuation patterns 65% of the time.  However,  it has been proven that LEPs are reliable reversal patterns if it is confirmed by another candlestick.  There were altogether 6 LEPs having such confirmation:-


Example 1 :- a bullish engulfing top occurred on 31 Oct 2007 and confirmed by a down day.  DOW lost about 200 points or 8.5%


Example 2:-  a bullish engulfing top occurred on 19 May 2008 and confirmed by a down day. DOW lost about 5000 points or 38%


Example 3:   a bullish engulfing top occurred on 21 July 2011 and confirmed by a Bearish Harami. DOW lost about 2000 points or 16%


Any New LEP Spotted?

A LEP was spotted 2 days ago and confirmed by yesterday's bearish engulfing.   It would appear that DOW will be heading down and would not test or break the rising wedge that was shown in the attach.


Update 1: 10 Jan 2013 Last Bullish Engulfing Null

The LEP was null with Alcoa presenting better earning results after the close of 8 Jan  followed by report of 14% increase in the Chinese export on 9 Jan.  These 2 economical data added 142 point to DOW and created a bullish engulfing pattern which will test the major resistances at 13,600.  However,  the trading volume at the point of the break was not impressive.   In the event it fail to break through the resistance,  a double top will be formed.


Disclaimer: Please verify the information if they are to be used for trading purposes

Tuesday, December 18, 2012

The Last Bearish Engulfing Pattern for Olam


18 December 2012

Introduction

After having created a false breakdown, Olam’s stock price continued to slide about 7% from SGD$1.50 on 6 Dec to SGD$1.39 on 17 Dec. A reversal pattern called “Last Bearish Engulfing” pattern was spotted yesterday and the reversal was confirmed today.


What is “Last Bearish Engulfing” Pattern ?

Engulfing patterns are reversal patterns. Normal Bearish Engulfing patterns will only occur at the top of a trend and Bullish Engulfing pattern, at the bottom.  The various different engulfing patterns and their trigger and failing conditions are as shown:-


However, when buyers and sellers were caught trading in the wrong direction,  they form "Last Engulfing" patterns; for example, the “panicked” sellers are selling their last stock position yesterday and thus creating a Bearish Engulfing patterns. It is true also when “hopeful” buyers are buying once more at the top, thus forming a Bullish Engulfing patterns at the top. Experienced traders will take the opportunity to either buy up the stock at the bottom or sell down the stock at the top when they see the occurrence of any “Last Engulfing Patterns (LEP)”.


However, LEPs are not exactly reversal patterns. Some chartists, after some countings, were of the views that LEPs are actually continuation patterns for 65% of the time. Unlike the normal Engulfing patterns, some traders were confused. They short or buy the stocks at the wrong time for a wrong price; as a result, there were no concerted effort to push the stock very far. Like the normal Engulfing patterns, LEPs will need confirmation candlestick to determine the direction.

Trading Recommendation

Because LEPs are not real engulfing patterns, it is likely for Olam to go as far as testing the major resistance line shown red in the attached. It is therefore not recommended to enter the market, not until the price has crossed above the major resistance line with +DI also crossing above –DI, which are signs for a full recovery.


Update 1:  28 December 2012  Last Bullish Engulfing Pattern

After having created a Last Bearish Engulfing pattern on 17 Dec,  Olam's price rose about 10% from 1.39 to 1.56 in a week.  Today,  it formed a Last Bullish Engulfing pattern at the top as shown.


The textbooks are mixed about this Last Bullish Engulfing pattern.  Some said this pattern will break up most of the time;  others said that this is a bearish reversal pattern that will break down eventually as shown in this chart.


Usually when rights issue is being issued, the stock price will fall due to price dilution on ex-Rights day.  However,  Olam's price  did not drop as if it was being supported due to prolonged down trend.  Last Bullish Engulfing pattern will need confirmation to determine the direction.


Update2:  7 Jan 2013 Last Bullish Engulfing with Bearish Harami


After having formed the Last Bullish Engulfing candlestick on 28 December,  Olam's price rose about 10% and formed a Bearish Harami on 4 Jan 2013.  It is as if the investor knew the price would fall as Temasek would not buy as it took up the remaining Rights issues.   The Bearish Harami reversal pattern will be confirmed if today is a down day and Olam's price will continue to fall and may go even lower than the last low.


Disclaimer:   Please verify the information if they are to be used for trading purposes


Thursday, December 6, 2012

A False Breakdown in Olam International?


6 December 2012

Introduction

Olam was attacked by Muddy Waters who has a “strong sell” rating because Olam has accumulated debts (current and long term) of over SGD$8.0 bil. Olam counteracted the attack by raising more fund with the backing of Temasek, who has 16% share in the company.

Olam’s stock price dropped from a high of about SGD$2.00 in Oct 2012 to the present level of SGD$ 1.45. Olam was expected to form a bear flag but today’s trading showed otherwise. It went below yesterday's close with lesser trading volume.  Is there a false breakdown in Olam’s trading?

What is a False Breakdown?

A false breakout or breakdown is usually referring to stock price that wanders out of a range,  making  temporary price movement up or down but soon returns back to its original position. This usually happens when stock breaks a support or resistance lines without any support of trading volume to sustain the move.

One example is as follows


Why?

In the case of a false breakdown, the shortists either run out of fund or not aware of prevailing news.  They  continue shorting the stock until the price started to show “exhaustion” without much support from the other shortists. When that happens, the bulls will  enter the market forcing the shortists to cover their shorts. The same will happen when there is a false breakout except it is in reverse.

Example?

Olam has a living example. In May 2012, Olam’s 3rd Quarter profit ending March 2012 dropped 23%. The market took it for spin. Olam’s share price dropped about 30% from about SGD$2.30 to SGD$1.60. Unknown to many, Olam’s June report showed an operation profit of SGD$350 mil which is only 4% less than that of 2011. The stock recovered much of its losses to end at about SGD$2.10 in August.


Olam started out with a bear flag having a target of around SGD$1.70.  When the target was reached, the shortists continued shorting the price down to SGD$1.61 with 2 false breakdowns; one on 24 May and the other on 1 June. Unfortunately, there were no volume support for both breakdowns. Olam soon recovered when there was a price exhaustion,  creating a candlestick gap followed by a bullish engulfing candlestick reversal pattern. The shortists were forced to take cover after that.

What Happened Today?

With an unsuccessful attempt to push the stock price to below the last low of SGD$1.50 yesterday, the shortists made another attempt today. This time,  they managed  to push the price to close at SGD$1.45;  unfortunately,  there was no volume support again or volume was lower than the last 2 sessions.

Is it really a False Breakdown?

It is a false breakdown according to the text book. However, unlike the one in May 2012, this breakdown occurs after having broken down the long time support of a symmetrical triangle with a very heavy volume. The situation this time is different. It is likely if there is any recovery, it will have to test the long time support of the triangle which is now becoming the resistance.


Time to Enter the Market?

It is still pre-mature to enter the market and shore up the shares. This is because the following indicators have not shown any sign:-

a) The Average True Range (ATR) is still rising

b) The Directional Indicator ADX is just flattening out;

c) The Stochastic still hugging the oversold line and yet to recover

The price may wander down somemore with another false breakdown just like in May 2012.

What are ATR, ADX and Stochastic?

They are basic indicators that show the stock’s volatility, the momentum and the price movement respectively. ATR will rise when there are abrupt changes in the price. ADX will rise when price picks up the momentum and then accelerate.  Stochastic become oversold when it goes below 25% and overbought when it goes above 75%.

How to Monitor?

Take the May 2012's  price movement as an example. The ATR started flattening out and went down from mid May 2012. At the same time, ADX continued to rise until 1 June 2012 together with stochastic going on its way up soon after. When the price was about to recover, a bullish engulfing candlestick reversal pattern appeared after showing an "exhausted" candlestick gap.  

Similarly, ATR, ADX and stochastic together with candlestick patterns can be used to monitor and confirm if the present breakdown is false and also when the price will recover.

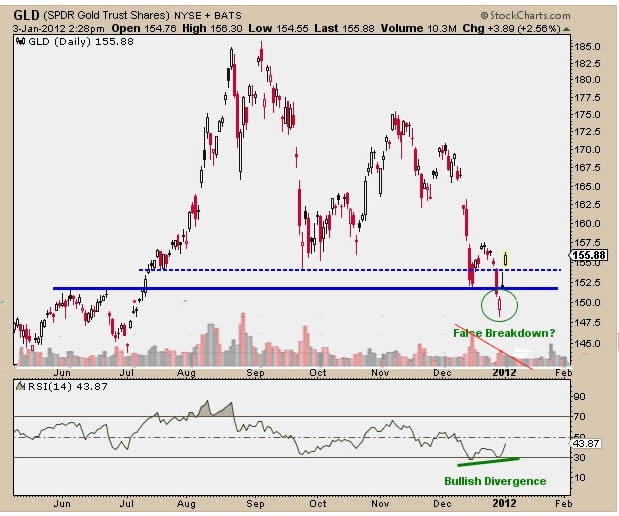
After Note:  One could also use Relative Strength Index (RSI) to track the stock movement.  Presently,  the RSI is showing a positive divergence,  starting to climb up the ladder.  Its performance will improve if it can climb above 30.


Disclaimer: The author has no position in Olam. Please verify the information if they are to be used for trading purposes.


Wednesday, December 5, 2012

Is Olam International Falling Apart?

5 December 2012

Introduction

Olam International (ticker O32 in SGX) was attacked by Muddy Water (MW) who had a “strong sell” for this counter. MW also claimed that the capital (bonds and warrants) recently raised by Olam "solve nothing";  it only prolonged the debt problem. Some market players also had this perception and was of the view that the recent Olam’s effort to raise capital had also the diluting effect. Lets examine Olam’s future from the charts.

The Olam’s Chart


The Olam’s trading chart will show that Olam’s price has been going down trend since NOV 2010.  It did not stop sliding.   Will it continue to slide?

The Big Triangle Trading Pattern

Since Dec 2008, Olam has been forming this big triangular trading pattern. The price cut below the pattern on 27 Nov 2012 when MW attacked it by saying in one conference that Olam would be in financial trouble. Though the price recovered the second day, it soon dropped below again. 

On 4 December 2012,  Olam announced that one of its White Knights, the Temasek of Singapore, was backing its fund raising of SGD$1.50 Bil. But the price failed to pickup;  instead, it closed at the day's low of 1.60,  below the triangular red line.

What’s ahead?

It is not immediately clear if Olam price is forming a bear flag although there are symptoms such as falling volume and negative MACD etc. It will be clearer if the future trading prices do not go above the triangle red line with the price,  forming rising channel or triangle trading patterns and the trading volume,  continuing to fall.

Trading Recommendation

Unless Olam can show that it can make good earnings in the future or its knights can shore the price up, it is likely that the price will tank.  This counter is only good for day trading at the moment.


Disclaimer: The author has no position in this counter. Please verify any information if it is used for trading purposes.


Sunday, December 2, 2012

Insulation for Reef Tanks


2 December 2012

Introduction

Many reefers use chillers to cool their reef tanks to mimic the environment of the living corals and other ocean creatures. The tank is usually kept in temperature around 25-28C. This article will examine how much energy can be saved by insulating the tanks.

Heat Gains

One of the heat gains of the aquarium is through the glasses which have thickness varies according to the tank capacity. The thickness ranges from 5 mm for a 2 ft tank to about 12 mm for a 6 ft tank. The heat gains or energy losses will vary according to the thickness of the glass; the thicker the glass, the lesser the energy losses. The heat gain through the exposed glasses can be responsible for 50% of the energy losses for a 2 ft to about 12% for a 8 ft tank.


Energy Savings

As aquarium operates 24 hrs/day, the heat gains by the tank is non-stop over the period. These heat gains will have to be removed by chiller; otherwise, the cooling will not be effective. By insulating the tanks with ¼” thick polystyrene foam for all sides except the font viewing panel, as much as 30% of the energy can be saved and hence, the cooling bills.  The thicker the insulation, the more the energy or cooling bills will be saved.

How Much in $ and Cts?

Assuming one has a ¼ hp chiller and a 3 ft tank (36x24x24), the energy saving will be about 10% of the chiller running bills. If we further assuming that the chiller runs about 8 hour per day, the chiller kwh consumed will be about 370watts x 8 hrs/day x30 days = 88 kwh per month. With rate @ SGD$0.2727 per kwh, the cooling bill will come up to about SGD$ 24/=. The saving could be as high as SGD$ 2.50 per month.

Foam As Backdrop


This reefer uses foam to mimic the rocks as a backdrop. This arrangement will improve thermal insulation and reduce heat gains or energy.  It would be more effective if he can also seal the edges of the foam so that there will be no water movement in between the glass and the foam. 

 His tank finally looked like this


Other Relevant Sites 
tinyurl :  https://tinyurl.com/y9vs4pzx

Wednesday, November 28, 2012

LED Lighting Saves Energy?

28 November 2012

Updates:   This article is no longer applicable today.   LED technology has so many advances that it has overtook the events.  They can now produce LED lamps that are not only cheaper but also brighter and can save more energy than a conventional system

Introduction


Today, everyone is talking about  LED lighting. Many who used LED lightings before can  swear that such lights will save running bills. They also run cooler. This article will examine if it is true.

What is LED?


LED stands for Light Emitting Diodes. It was discovered in 1907. It is a semiconductor product. When a current passes through, it will emit lights as well as some heat. The earlier LED has only one colour, Red. Today, they are available in multi-colors. They match light spectrum of many other lightings. Some used LED lights for aquatic and reef tanks.


Are They Energy Efficient?

Lamp efficiency is often measured by lumens per watt (lm/W). Lumen is a measurement for lighting power emitted by the lamp. The earlier LED has a lm/W of around 65. This is about 4 times as efficient as incandescent lamp which is around 15 lm/W. It is still not as efficient as fluorescent lamp which is around 110 lm/W. Some manufacturers ever claimed that their LED can go as high as 160 lm/W but the United States Department of Energy (DOE)’s tests in 2009 showed that the LED lamps that were used to replace their existing lamp had only 17 to 79 lm/W.  Luxeon,  a well known US brand,  claimed their LEDs having the highest flux in the World;  they can only produce 30-40 lumens per watt.
 

Why Claimed to be Saving Energy?

Many who used LED lamps before always claimed so. They claimed to use lesser numbers of LED fittings for the same room.  Even the DIYs can tell one another to use only about 60% of LED in terms of wattage power. What could be wrong with DOE’s tests?

DOE’s Test Conditions

DOE’s explanation on the test conditions can be found here.

Its report clarified that the tests did not

a) Cover the measurement of luminaires;

b) Take account of the life maintenance

Luminaires Make a Difference?


Do a simple experiment. Use an incandescent bulb. Compare the lighting between one that has a reflector and one without. One will tell that the one having a reflector is much brighter. Similarly for LEDs.

The small LEDs of 5 mm usually have an in-built lens to concentrate the light source. 


The larger ones of 0.5 watts and above do not often have the lens as they are usually sold separately.  Many commercial LED also do not have the lens for each LED.  Different types of lens are available in the market and can be added to the LEDs to change their  beam angles so that lights can be focused in areas most needed for maximum efficiency.


Furthermore, efficient reflectors can also be designed for LEDs because of its smaller size and lesser heat emission.  Therefore, they can be much more efficient if the luminaires are also considered.

What Other Considerations?

One factor most users overlooked is the actual power consumed by LEDs. Actual power consumption will include KWs as well as KVARs. The latter is referred to as the reactive power that is not often charged in the electricity bill but will have to be accounted for when selecting the capacity of any generator.

Why?

The difference between fluorescent and LED fittings besides the lamps is the design of the ballasts.  The former uses magnetic ballast and the latter uses LED driver.  Both consume KVARs; inductive in former and capacitive in latter.

For a 30 watts T5 lamp, the fitting consumes only about 4 VAs or around 13%.


One LED driver with capacitor arrangement is shown below, the VAs consumed by this kind of driver could be as high as if not higher than the lamp itself.


Therefore,  when one measures the electric current consumed by LED lamps,  do not be alarmed as one is only charged for the KWs used.  The Power Generating Companies would not like this kind of LED drivers.  As for factories and large energy consumers where power factor is also charged,  it is not exactly a good idea to convert all fluorescent fittings to LED fittings as the power bills will not reduce by much.


What is the life of LED?


This DOE's chart showed that LED has longer life than some lightings and comparable to T5 fluorescent lamps.


Is it Worthwhile?

Unlike incandescents that can be hot in operation and fluorescents,  big and bulky,   cheap plastic reflectors can be supplied as a standard for LED lightings;  also,  lens can be easily added to LEDs to focus lights in areas most needed.   These reflectors and lens can improve LED's efficiencies.   

LED lightings can be energy efficient when compared to others such as incandescent and fluorescent fittings if they are fitted with proper lens and reflectors.  They can be a worthwhile investment except today's good LED lightings come with a price.

Sunday, November 25, 2012

Air Conditioning Filters


25 November 2012

Air conditioner is an essential thing to have in Singapore.  Maintenance of these air-conditioning equipment will involve regular cleaning of the air filters;  also,  the coils may  require chemical cleaning to restore the cooling efficiency from time to time.  This article will introduce a micro non-woven fabric material that will help to keep the cooling coils as clean as possible and to reduce maintenance requirement.


What is Micro non-Woven Fabric Material?


Non woven fabrics are sheet bonded together by entangling polyethylene(PE) or polyester fibers. They are porous sheets that are made from plastic film and not by weaving or knitting. Polyethylene or polyester is used everywhere;  in plastic bags,  plastic films etc.  Non woven fabric has many applications;  one of which is used in mops and brooms that we used to clean the floors. It has natural static charges making it suitable for air filtering work.


Their refills are cheap and a plenty in the market. The refills will cost only around SGD$ 1/= for 35 sheets of 200 x 300. There are 2 types in the market; the other one measured only 200 x 290 can be used for smaller air conditioners.


Application


The fiber sheet is placed just before the original air filter. To stick the sheet to the filter, just use the hook of the Velcro Fabric Fasteners stapled or glued onto the original filter. The hook will “catch” the fiber sheet and secure it in place.

The author has used the non woven fabric material for more than 4 years now without any ill effect on the occupants as well as the air conditioners.

This filter shown below was renewed about one month ago. Dust can be seen accumulating at the corners. When the fiber sheet is lifted up, one can see that there is no dust on the original filter at all except along the sides that was not fully covered by the filter.


Air Resistances


One of the concerns is that the additional sheet of filter will impede air flow. The author has no measuring equipment to measure such impedance. But the fiber sheet was so thin that one can even read the words “e-ion Air Purifying System” clearly written on the original filter as shown in the photo. The air conditioner can still work at its lowest speed without any degrading in performance.

Even if there is air resistance, it won’t be as high as when the fins of the air conditioner were clogged up with dirt; then only chemical cleaning work will restore the efficiency. By then, one would have wasted quite some energy without proper cooling for some period.

Application

This air conditioner shown below has been working every night for the past 4 years.  Non-woven fiber sheet was used since day one. The fins at the coil still looks very clean.  One can even see the reflected shine on the tube of the coil when a touch light was shined at it to take this picture. So far, no cleaning has ever been done on coil.   The gap of the fins is about 1mm which is slightly thinner than a 5 cts Singapore coin as shown.


Saturday, November 24, 2012

US Long Term Mutual Fund Flow


24 November 2012


Introduction

The Investment Company Institution (ICI) is the national association of US. investment companies. It  tracks many business activities including those of mutual funds. Its members manage total assets of about $13.8 trillion all over the World and serve more than 90 million shareholders. It publishes Long Term Mutual Fund flow weekly. Its publications can be found here.

What’s the Use?

The data published by ICI on the money flow of the Mutual Fund (the Fund) has been used often by many to track the general market directions. A plot of the data is shown below:-


Chart Analysis

The chart shows the Fund’s money flow against S&P. It can be seen that the Fund are quite sensitive to the changes in the stock market. The fund curve exceeded stock market curve in 2007. As the market started its downward trending, the Fund discharged its holding sharply until mid 2008 where they dumped as much as they can. At one stage, the Fund dumped more than USD$180 billions per month in total. When market started picking up in March 2009, the Fund loaded heavily. Today, they are keeping bonds at reduced level but started selling equities averaging around $15 billions per month

What Can We Learn?

One can use the Fund’s money flow to chart market direction. Be the first to load when one sees the Fund are loading heavily and vice versa.  Note that this mutual fund money flow indicator tracks better than the Junk Bond ETFs indicator described here before.

Use Junk Bond ETF to Track Market Direction?


24 November 2010

Introduction


It was said that Junk Bond traders are knowledgeable, involved, and speculative investors. Junk bonds offer higher future return than corporate investment-grade bonds. Because of the higher volatility and risk, Junk Bond traders are often more sensitive to the market movements. Let’s examine if we can use their trading behaviour to track the general market direction.


Junk Bond ETFs

The market offers 2 junk bond ETFs; they are iShares iBoxx $ High-Yield Corporate Bond (HYG) and SPDR Barclays Capital High-Yield Bond (JNK). Their data can be downloaded from Yahoo Finance for analysis and tracking.


How Did Junk Bond Perform?

In order to filter out the noises, we will examine the monthly plot first as shown


HYG appears to be tracking DOW quite nicely during the period from 2007 to 2010. From then on, DOW took off and HYG was not doing well for some reasons. This chart does not tell much. It only tells that junk bond buyers were not as confident and as active as stock market players in the recent months.

Correlation with DOW

If we add a chart that shows direct correlation with DOW, the picture will be as shown:-


It is clear that though the Junk Bond traders were not as confident but they were not losing track. They hold-on to play the bonds during periods between 2009 to date except that they did not respond as fast to sell their bonds in 2008 until the stock market had almost bottomed. They also buy bonds when market is falling.

From the chart, one can tell that junk bond investors are always investing ahead of the stock market. So there is a time lag between the stock and the junk bond tradings.


Applying the Time Lag

When one projects HYG 6 days in the future and correlates back to DOW, one will find a completely different picture as shown in the attached.


 The new indicator tracks closely with DOW. It gives signals ahead as to where DOW will move next. The chart shows that the stock market is presently trending downwards but there is no immediate danger until the new indicator crosses below the zero line.


What about the Weekly and Daily Charts?


There are far too many noises to track the market using weekly or daily charts. However, one can still gauge if the junk bond investors are active although the signal will be confusing.

How to build the indicator

If one has metastock or similar software, one can build the new indicator using the following formula:-

Correl(Security("C:\MetaStock Data\sample\I\IDJI-1",C),Security("HYG-1",C),5,6);0


Conclusion

The Junk Bond ETFs can be used as an alternative indicator to track the direction. The monthly chart especially the correlation chart projected 6 days into the future has a much clearer picture;  however,  it does not track better than the US Long Term Mutual Fund flow indicator described here.


Simple and Easy Way To Backup Photos, Movies and Documents from handphones

 2 December 2023 In the past,  we used iTunes when we wanted to transfer or backup our photos,  movies, and documents from iPhones or Androi...