What is Secular Bull or Bear Market?
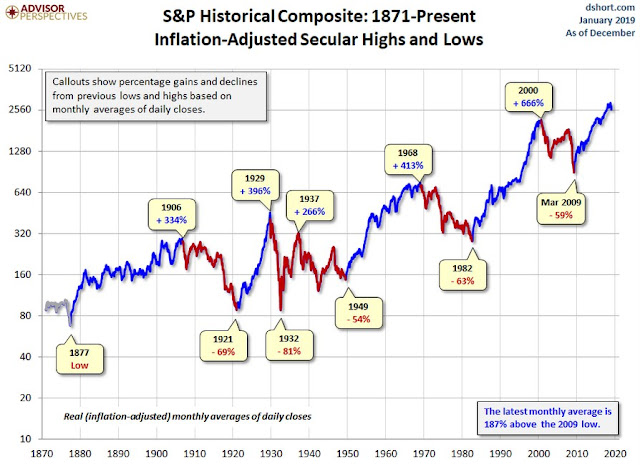
“Secular” came from the Latin word saeculum which means "long period of time". Some Stock Analysts use this term to describe “Long Term” bull or bear market that spans over a number of years. Some plotted this graph to show the various secular bull and bear period from 1877 right down to 2018.
As can seen from the above chart, the secular bull market is inked blue and secular bear market is inked as red.
The Study Works
Over the years, many Analysts used all sort of “theories” and mathematical tools to analyse how and why stock market behaved all these years and if a pattern could be “drawn” from their results.
For example, Mr. Napier “dissected”the bear market of (1921, 1932, 1949 and 1982) to help his readers understand better about the market bottoms. He based his work on the past to describe what are secular bull and bear markets. Mr. Ed Easterling, on the other hand, used mathematical tools such as Price Earning ratio (PE) and market fundamentals to explain about the secular markets.
Then there are others that based on either chart pattern, time frame and market cycles; some even based on “magnitude & size” of the markets to identify the top and bottom of secular bull or bear markets.
The Characteristics
Secular bulls and bears have different characteristics; however, there is one thing in common, they often choke up large price differences over the period as shown in the following table.
The % of price rises in secular bulls is usually 10 times larger than that of the secular bears; also, the market milestone or period of the market of bulls is always longer than the bears. We can therefore say that it will always be “great” to be in a secular bull market. If we can know where we are, we would become very rich with our timely investments.
Where are we ?
Apparently, nobody in the Web can tell us exactly where we are. Every article in the Web has put a question mark against the present date. Some (especially those who believed in “timeframe” and “sizes”) claimed that we are in the secular bull market and we have reached the end of a market correction in a secular bull market; it is time to buy. Then John Mauldin claimed that we are in the secular bear market.
Now Where Exactly are we ?
With all due respect, the following article give the best advice, “Don't Get Hung Up on Secular Bull Markets or Secular Bear Markets When Making Investment Decisions”.
If one really must know where we are, Mr. Ed Easterling’s &
The Fundamentals
It is also important to point out the following significant “worries” found in the fundamentals inside our present economyDescription | Details | Remark (Doubleclick to Enlarge) |
1. Increasing Debt levels | 1. Debts are ballooning. US debt of the non-financial domestic sectors such as those in households, government and businesses are rising at a rate of 15% per year, reaching a scary height of US$50.9 Trillion or roughly about USD$150,000 per US citizen in 2018. | |
2. Leveraged Loans | The businesses are borrowing more and more loans from other sources at about 6 times the interest rate of the banks, who are not willing to lend. It was said that “The borrowers have $8 of debt for every $1 of cash” Read more about Leverage Loan here | |
4. High Margin Debts | The equity traders are borrowing margin loans at unprecedented rate that is almost 3 times the amount in 2000 & 2008 combined. Read more about High Margin Debts here | |
3. Missing Traders and Trading Volumes | Although the equity market has grown double in size with hefty margin loans than in 2008, the trading volumes of the market has been cut with lesser and lesser participants. Read more about Missing Traders here |
The Fifth Wave
For those who are interested and familiar with the Elliot Wave Analysis, they might have noticed immediately that the present inflation adjusted S&P historical chart has a pattern that complies with Elliot Wave analytical rules. It is as if the present secular bulls is the "fifth wave" which will have a shorter "wave height" than the 3rd wave for period between year 1921 to year 2000.Conclusion
In view of above, we can roughly confirm that our economy is no longer having the same condition as last recession in 2008. It is much worse. Many market participants have already left the market and the wealth is concentrated in the "hands" of a few “giant” companies and Corporates who are “manipulating” the market. We are likely to be at the end of short secular bull market, about to start a new secular bear market.Disclaimer: This article is for information and educational purposes. Readers are advised to conduct their own research and study to make their own investment decisions.
tinyurl : https://tinyurl.com/y9q7zmpm


Great piece of information. Very informative. No need to look elsewhere. Thank you very much for sharing this information.
ReplyDelete