Search This Blog

Thursday, September 7, 2023

Where SembCorp's Price is Heading?

Jump to article

7 September 2023

SembCorp closed yesterday with a price of S$ 5.08 which is 2.7% down from Tuesday's closing price of S$ 5.22.   SembCorp's price has lost a total of S$1.01 or 17% since 7 August 2023 when the news about SembCorp being listed in MSCI Singapore was first spread in various forums.  

This article will try to find out where SembCorp's price might be heading.

The reason why SembCorp’s Price was Falling

In the last article dated 1 September, we explained that Sembcorp stock demand would increase when it rejoined the MSCI index.  This is due to an effect called  S&P Phenomenon.    Unfortunately,  this S&P Phenomenon did not cause SembCorp’s price to rise but fall because the MSCI Singapore had not been performing to its best lately.    

Will SembCorp’s Price Rise Soon?

Many traders were expecting SembCorp’s to rise sooner because it has fallen quite a lot and SembCorp has reported a sterling result for 1H2023  Some even speculated the price would rise even faster and quicker than before if history can repeat itself.  Let’s examine in this article if this is possible from the angle of Technical Analysis.

Technical Analysis

Unfortunately,   the Technical Analysis from the following chart is telling us a different story.   This is because there are at least 3 weaknesses in SembCorp's technical chart.

First,  we see a dead cross with 20-day MA cutting below 50-day MA;  then,  we see:

  •  The price cut below the 100-day MA;  
  •  A bear flag formed with a target price below  S$ 5.00

Fortunately,   the 100-day and 200-day are still rising.  This will give hope that SembCorp's price might have a chance to reverse its course if the prevailing condition is favorable.

Click to enlarge the picture
Figure 1


What about the Prevailing Conditions?

Unfortunately,  the prevailing conditions are not able to support SembCorp's price at the moment.  Let's examine the various relevant indexes that can support the rise of SembCorp's price.  

a)   The STI & The MSCI Singapore

Click to enlarge the picture
Figure 2

B
oth the STI and MSCI Singapore indexes are littered with a lot of dead crosses.  It is not hopeful that they can lend any support to push SembCorp's price up in the shorter term.


Figure 3


The Global Indexes

The US and Hong Kong markets used to have a lot of influence on Singapore's stock price but lately, the Hong Kong market was in a mess and the US market has begun to soften,  ready to make further corrections.  For example, the Dow Jones Industrial Index (DJI) has made 2 straight falls in the last 2 days.  It is ready to form a bear flag as shown in the following chart.  DOW has also started to make the first dead cross with the 20-day MA already crossing the 50-day MA.  We will expect DOW to make lower lows with the present setup.

Figure 4


Conclusion

Given the above,  we are expecting SembCorp's price to drop further to test not only Support  S3 @ S$ 5.01 but also Support S4 @ S$ 4.86 as shown in Figure 1 above.    If these 2 supports cannot hold the fall,  the price might test the bear flag target price @ S$ 4.58 which happened to be also the Support S5. 


Disclaimer:  This article is for information and educational purposes.   Readers are advised to conduct their own research and study to make their own investment decisions.


Monday, September 4, 2023

Where Hong Kong and Shanghai Bources Heading?

1 September  2023

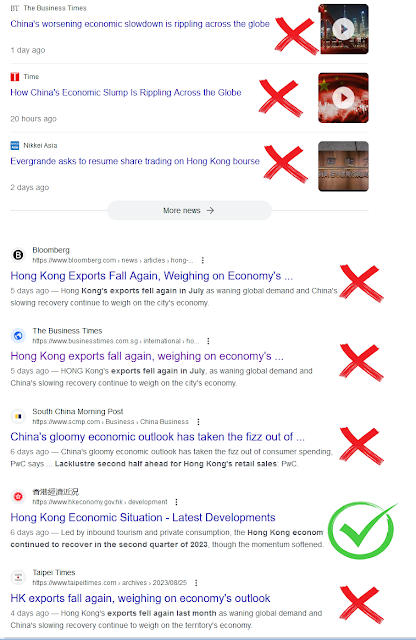
Using Google to search about the economy of Hong Kong and China,  we got the following picture


Seven out of the eight news have negative reports about Hong Kong and China's economy except one and only from the Hong Kong Government.   

In that report from the Hong Kong Government.  it pointed out that "real Gross Domestic Product (GDP) (of Hong Kong) grew by 1.5% year-on-year in the second quarter of 2023 after having increased by 2.9% in the preceding quarter. Nonetheless,  the report concluded by saying "the real GDP growth forecast for 2023 has been revised (upwards) to 4.0%-5.0%, from 3.5%-5.5% in May 2023"  

On the other hand,  the Chinese authorities in China have come up with various measures trying to lift the sentiments in the stock market and the business sectors,  including slashing the stock market trading fees. They are also trying to stimulate spending by cutting the bank deposit rate. 

This article will examine how the stock market has responded to all the measures and the propaganda done so far to uplift the market sentiments.


The  Shanghai Stock Market

The Shanghai market was performing pretty well before May 2023 and after China announced the re-opening of its borders in December 2022.  However,  the market soon started to fall apart in early May when there were reports about China's economy not performing as well as expected.  Also,  the retail sales of consumer goods were missing forecasts.  The Industrial output and foreign investment have slowed down.  

During the period between May and June 2023,  we saw the Shangai stock market lose more than 7%.  from 3,395 to 3,150 or about 250 points.  The market recovered a little when China vowed to come out with further measures to bolster the Chinese economy and lift the stock market performance.  These measures include slashing the stamp duties for IPOs,  reducing the stock trading fees, etc.  However,  these measures and efforts did not help much to lift the stock market because there was a slew of bad news about the economy not performing well and continuing to pump out.   

Technically speaking from the Shanghai Index chart shown below,  the Shanghai Index was littered with dead crosses all over (marked in the red circle).   

The more serious one appears to be the large red circle that shows the 20 MA breaking below 50 MA and the 20 MA and 50 MA breaking the 200 MA together at the same time on the same day.  That was just after 14 August  when Country Garden suspended trading in 11 of its onshore bonds with a forecast of USD7.16 billion in losses in the first half.  

The bad news about the bankruptcy filings of Evergrande in the US courts on 19 August further aggravated the market fall sending the Shanghai Index deeper into the red.  

The index tried to make an attempt to recover from the doom drum on 26 August but failed.


If we draw the Shanghai Index using candlesticks,  we can see that the Index struggled but failed to recover on 28 August 2023. That particular candlestick on 28 August covered up 2 candlestick gaps leaving one @ G1 behind to be covered in the future as shown in the following chart.


Given the above scenarios, we are not optimistic that the Shanghai Index will be able to recover from this recent fall and cause a reversal to happen soon. We are expecting the index to have a hard time climbing back to cover the gap at G1. Meanwhile, if the Shanghai index fails to break the resistance R1 @ 3,150 or goes above 20 MA, we are expecting it to seek lower lows that could go below 3.000.


What about Hong Kong HSI?

Presently, we saw HSI mimicking the pattern of the Shanghai stock market. It will aim to test the support trendline T3 if it fails to conquer and go above the resistance at Trendline T2,


Disclaimer:  This article is for information and educational purposes.   Readers are advised to conduct their own research and study to make their own investment decisions.


Simple and Easy Way To Backup Photos, Movies and Documents from handphones

 2 December 2023 In the past,  we used iTunes when we wanted to transfer or backup our photos,  movies, and documents from iPhones or Androi...