Search This Blog

Saturday, June 12, 2021

The Once-in-100-Year Flood in China

Disclaimer:  This article may stroke the sensitivity of some,  especially when some of news might not have been verified.   But it is  never the intention of this article.  China has a very strong fire-wall.  Many information cannot always be verifiedHowever,  fake news if spotted will be removed

Why this Article?

This article will try to track and share this once-in-100-year event.  The Authorities have known about this event. It has taken necessary precautions. Hopefully,  there will be little or no damages. In the process, we will learn something.

Which Article Said Once-in-100-Years?


This news artical said "Red Alert Warning.  Once-100-Year Strong Rain Attack.  Many Areas and Roads Have Been Flooded or Collapsed"

https://www.163.com/dy/article/GC53KD5S0514EGPO.html?f=post2020_dy_recommends


The Authorities only said this year's flood might be one of the worse.  Lets find out the truth. Time will tell.


What Has Happended So Far?


The flooding season in China usually started as early as in May and will end around October.  The worst time will be during August & September.  This year's flooding appears to have started early.  Some areas were flooded in April.  ZheJiang areas had extreme weather conditions during April & May.  The lastest flooding appears in GuangDong Province.   Many rivers have excessive rising water level.  YangTze regions appears to be calm so far with no serious flooding.

Here are some news (select from drop-down box)


back to top

22 May 2021:  Flood affected 147,000 people in 2 Districts in JiangXi.  They have started the Level 4 Flood Prevention Procedures.

http://www.chinanews.com/sh/2021/05-22/9483199.shtml

back to top

26 May 2021:   71 rivers exceeding warning level

https://www.reuters.com/world/china/chin...ce=twitter


back to top

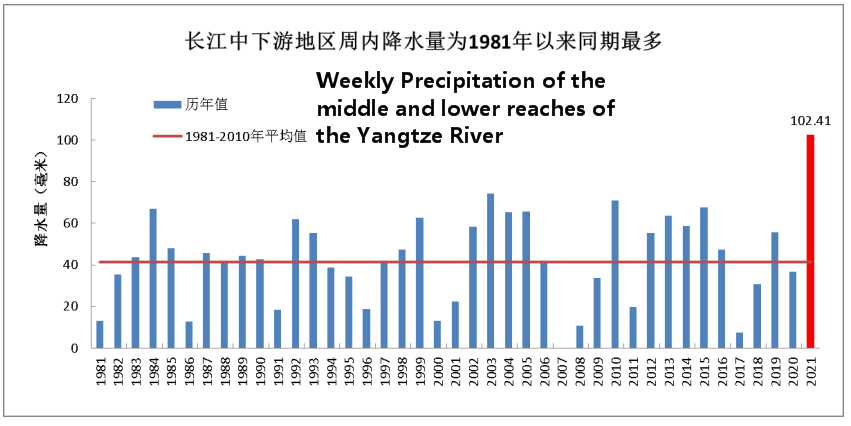
27 May 2021 :  Prediction about 2021 flood which is going to be worse than 1981-1984.  It is so much worse than 2020.    The market was expecting the price of cotton and crop to rise due to this massive flooding problem.  The map was trying to explain why there was  this flooding problem.

https://twitter.com/QMHedging/status/139...7290555392


back to top 

2 June 2021 :  Flooding in Southern China


6 June 2021:  Flooding in Zhuhai,  Macau and Hong Kong Areas

back to top 

7 June 2021 :  Massive flooding in GuangDong,  HuiZhou,  DongGuan and various other parts of China

back to top 

9 June 2021:  Warning about 89 Rivers having water about warning level

http://www.xinhuanet.com/politics/2021-0...545913.htm


10 June 2021:  Zhuji City in ZheJiang  Province having 100 mm of water per hour


back to top 

10 June 2021  Expert talking about many areas,  especially those in the South, have flooding incidents.  They said many areas experienced heavy rainfall: Hunan has more than a dozen rounds of heavy rainfall, causing more than 100 counties and cities to be affected to varying degrees; since May, Jiangxi has multiple rounds of continuous heavy rain. The rainfall is much higher than normal; recent heavy rains have occurred in many places in Guangdong, and serious waterlogging has occurred in some urban areas.

https://www.sohu.com/a/471511503_267106


12 June 2021 :  50% wheats was harvested and 64,000 km2 were planted with corns.  This is far cry from the 90% harvest of wheats havested last year and 174,000 km2 planted with corns during the same period.   China said it will speed up the harvest using machineries.  China will have to depend lots on imports if the harvesting is badly affected.  According to Rueters,  China huge supply stock of wheats has known to peaked in March.  No one knows the details about the storage capacity.   Nonetheless,   China's imports had increased by 45% and  corn prices increased by 40%.


(Click pictures to enlarge)


back to top 
The flood in ZhengZhou,  China  22 July 2021


Monday, June 7, 2021

Why They Said Some Brands of Vaccine were Not Effective?

4 June 2021

(Updated 8 June 2021)

"The Week" has this news article. It said that "the Chinese's Covid-19 vaccines appears not effective." Is this true? Why they are saying so? Do they have any reason? This article will describe a simple method where one can use to verify if what they are saying is really true.  

About The Week 

First, about "The Week". This is a weekly news magazine with editions in the United Kingdom and United States. Although it is a bit left biased, most media rating agencies rated them as unlikely to give fake news. The following is its news report on 4 June 2021. 

https://theweek.com/china/1001165/chinas-covid-19-vaccines-dont-appear-to-be-effective-in-preventing-outbreaks-in-the


 Responses

Netizens have mixed views. Those in favour of conventional vaccines like the inactivated vaccines have not agreed. They insisted that this news was very biased.  Some said "This Week" was reporting fake news.  Lets examine this news with real World data from "Our World in Data"

How to Examine?

We can use available charts in "Our World in Data". One of them is "the number of people who received at least one dose of COVID-19 vaccine' as shown on the left. The other is the 7-day rolling average of "Daily new confirmed cases per million people" . it is as shown in on the right. These 2 charts are arranged side by side for easy reading. The one on the left shows how much 1st dose vaccines have been given. Effective vaccine should bring down the rate of daily new confirmed infection shown on the left.

(Note: The following 2 charts for infection and death rate are interactive. One can change and add countries to get the desired results. The followings are countries that has been most affected by Delta)


The other chart that will be useful for comparison is   "Share of people receiving at least one dose of vaccine vs Daily Deaths Per Million People. This chart tells if the vaccines are effective to curb death rate in the country.


Putting 3 Chart Together

It will be clearer at times to put the above charts together for comparison purpose
(Note: these chart are interactive. Change the country name as wished. Clikc remove side bar for larger view plus many more charts)


User Note on How to Navigate

1. Select the country by clicking the text button "+Add country". Then tick the appropriate check boxes. The chart will update automatically;

2 Note that the charts are not of the same horizontal scale. To compare, adjust the scale on the right hand chart. This is done by draging the scale at the bottom of the chart using the mouse;

3. The death rate would be more realistic than infection rate. The infection rate can be lowered if country has not done enough testings. Refer to Worldometer for testing frequency.

Chart Interpretation

Take UK US & Israel for example,  we can roughly say their vaccines are working to tame the infection. Their infection rates came down as soon as the vaccination numbers went up.


For Bahrain & Uruguay, there is still no sign that the infection rate has been tamed at all.   These countries will need to check if their vaccines are able to deal with the Covid-19 variants.


As for the case in Brazil and Chile, they managed to hold the infection rate. There is still no sign about when will they be able to tame the viruses.  Chile might have a vaccine that is not able to tame the Covid-19 variant.


The situation in Seychelles is not much different from the rest of the other countries. This tiny Easteern African island in the Indian Ocean has a volatile infection rate.


Some claimed Turkey and Hungary using inactivated vaccines.  They also tamed the vaccine successfully.  This "story" is not quite true.  Turkey used about 20-30 millions of Sinovac before April & they have more Pfizer now with supplies totalling 120 millions doses.  As for Hungary,  they have supplies from European Union until May;  by then,  the infection was almost over.


Take Away

Vaccines are highly politicized by various countries. This article describes only a simple method on how to check the effectiveness of vaccine using available public information. For those interested to know what brands of vaccine these countries are using, please refer to this webpage.   One can also find out how many of which type of vaccines have been used to-date by some countries in terms of numbers and % from the webpage.

This simple method is to give an idea on how one could judge if the vaccines are effective. Previously before we have vaccines,  many countries like China,  Singapore, Japan, Australia, New Zealand & Taiwan were able to tame Covid-19 using the traditional control methods. These methods are Covid-19 testings,  mask wearings,  quarantine, safe distancing & shutdowns.    

 https://tinyurl.com/v8j3b3t9


Wednesday, June 2, 2021

Coronavaccine Really Works?

 2 June 2021

 
This question was always in some people's mind.  We are hearing people saying "You can bluff and lie,  Covid-19 will prove you wrong"  

In this article,  lets explore some real World cases using graphs and data from Our World Data.

Cases in United Kingdom & United States

We heard many stories about how UK and US have tamed Covid-19.  These 2 countries have relaxed their Covid-19 protection guidelines. They are no longer insisting their residents to wear mask under certain conditions. They are also relaxing the social gathering & distancing rules. 

Lets examine their vaccination rate and infection rate to-date in these 2 charts.   If the vaccine is effective,  it will definitely help to bring down the infection rate

a) Daily COVID-19 vaccinations administered per 100 people


 Visit here for more charts and information

 b)  Daily new confirmed COVID-19 cases per million people


  Visit here for more charts and information

Unfortunately,  it is hard to digest the above chart because they are in different scales.  Lets superimpose the 2 charts and bring them in line as shown in the following chart


One could immediately see that in the case of UK and US,  the vaccine has brought down infection rates. The infection rate was a high of over 600-800 case per million people in early Jan 2021. Now it is only 40 cases per million people in Jun 2021 which is a 93% cut.  This is despite UK and United States have reduced the of vaccination rate about 2 to 3 months ago. They cut the rate in March to April 2021 from 80-90 per 100 people  to the present rate of less than 30 per 100 people in US.

In Conclusion

One can say that vaccine does work to bring down the Covid-19 infection rate as far as UK and US are concerned.  On how long this will  continue to work  will depend how fierce will be the coronavirus variants.  Science is telling us that virus will always mutate. They will mutate into a new kind of virus that will resist existing vaccines. 

In here, one can find out what brands of vaccines used in various countries. The webpage contains an interactive chart, providing some information about the vaccine brands. 

Doubleclick here or the picture for interactive chart


https://tinyurl.com/4yx5987c


Update: 10 June 2021

Here is a better way to compare the effectiveness of vaccines being deployed in various countries.   Not all vaccines are equally effective.  Some can tame Covid-19.  Some are struggling even without the attack of new variants which are more vicious and infectious. 

 https://tinyurl.com/v8j3b3t9 


Wednesday, May 26, 2021

Does Vaccine Efficacy Really Matter?

22 May 2021

Discussion about Covid-19 vaccine is super hot nowadays. There is a vaccine shortage at present. Many countries are chasing after available vaccines. Even many of those not yet approved by World Health Organization (WHO) are snapped up. Why it is so?

To convince their people to take vaccine, some countries claimed the vaccines are safe & effective. Some even provide incentives to promote vaccination. This is despite there is still no approval from WHO. They are creating free publicity for the vaccine manufacturers. Why it is so?


Why?

To understand better, we'll do some simple maths. We will compare the cost of vaccines vs traditional measures to control the virus spread.

There was an outbreak recently in Singapore. A new variant called B1.167 created havoc. It infected about 400 people within a short span of a month. To control the spread, Singapore Government tested about 400,000 people. They were suspected to have close contact with the infected person. This 400,000 works out to roughly 1,000 tests per infected person.

The following table will show that it will be more cost effective for the Government to opt for vaccine. Besides being less disruptive, the effect of vaccine will last much longer.  Note that the cost excluded  treatment and all other cost which could be quite substantial as well for the traditional control method.


What Does Vaccine Efficacy Means?

Vaccine effectiveness is often measured by the term called vaccine efficacy.  It is worked out by using this standard formula.


Vaccine manufacturers are required to carry out their trials in 3 phases. Phase 1 & 2 are for testing out the safety whereas Phase 3 trial requires  30,000 people or volunteers. These people are divided into 2 groups, one fully vaccinated and the other without. These people shall live in a controlled community. They are required to live and work in virus infected environment. Their conditions are monitored in regular intervals. At the end of Phase 3 trial, their virus attack rates are used to work out the efficacy using the standard formula.


Does Vaccine Efficacy Really Matters?

There is no medicinal cure for any type of viruses found today. Viruses are known to mutate & survive in new & tougher environment.  The new variants are also known to be more infectious. One can imagine what it would be like when a vaccine  cannot "kill” and wipe out the entire virus colony.


How Vaccine Efficacy Matters?

Take the case in Singapore again. The present outbreak had 78 infected among the 400 people.  These 78 people  had full dose of vaccine. This translated to a total testing cost of about SGD$72 millions as shown earlier.   This was because the vaccines used in Singapore has a vaccine efficacy of 95% . What would this testing cost if the efficacy was 60%?

To work out this number, we can use the efficacy calculation template as shown in this webpage. We can change the number in row 10 or the "number of fulldose infected". Now,  if we change this row 10 number to 320 instead of 78, we should get the vaccine efficacy number to be roughly 60%. 


    In other words, if Singapore's vaccine were 60% and not 95%,   Singapore Government would have to spend another $57 millions on testing cost. The total testing cost would then be $129 millions and not $72 millions. 

     Using the same method by changing the numbers in row 10,  we can plot this following chart that will show the vaccine efficacy vs % vaccinated people infected.  


In conclusion,  Vaccine efficacy really matters.  To control the spread of Covid-19 using vaccine of lower efficacy will jack the testing cost by inversely proportional amount. 


https://tinyurl.com/jnbkephp

Saturday, May 22, 2021

Important & Significant Covid-19 Data

22 May 2021

Please use dropdown box to select chart to view

Note:   These are interactive charts displayed with courtesy of ourworldindata.org.  They are extracted and embed here for easy reference.  User can "Add Country" to change the country name etc to get the required information

1) The percentage of population receiving at least one dose of COVID-19 vaccine  

This data is significant because it indicates if a country is able to contain the spread of the virus. To contain the spread, adequate number of people must be vaccinated. This number in % of total population is often referred to as the threshold of herd immunity. This is the level where one can expect the spread of disease will start to decline. Different diseases have different threshold of herd immunity. For Covid-19, this level has not been established yet. But many experts believe it to be around 60% to 75%. For Polios & smallpox, it was 80% to 86% and for measles, 92%-95%. 

The 1st dose figure is more significant than full dose figures. Some have been quoting vaccination in terms of per million people. This figure unfortunately could not tell if a country is in a position to stop the spread of the virus.


 This chart is the vaccination rate among ASEAN countries


back to top  

2.  Daily COVID-19 vaccinations administered per 100 people

This figure is important as it shows what is the present day vaccination rate.  A lower figure will take the country longer time to reach the threshold of herd immunity which is around 60%-80%.

back to top  

3.  COVID-19 vaccine doses administered

This is a good to have chart to find out how many doses have been administered in a country.  The country with higher population will show a higher number.  It will not show if the threshold of herd immunity has been reached and the country is safe from infection.


back to top

4. Daily new confirmed COVID-19 cases

This figure are often used to judge if there is a reduction in the rate of infection. However,  this figure is not quite significant. It could not also tell if the control measures are effective. This is because there are too many variable in the real World..


back to top

5.  Daily new confirmed COVID-19 cases per million people

Similar to daily new confirmed COVID-19 cases,  this figure is important to get a sensation feeling but not quite significant. Good to know how country is doing.  With the information of % vaccine doses given,  one can also tell roughly if their vaccines were working to control covid-19.


back to top

6.  Daily new confirmed COVID-19 deaths per million people

Similar to daily new confirmed COVID-19 cases,  this figure is important to get a sensation feeling but not quite significant. Good to know how country is doing.  With the information of % vaccine doses given,  one can also tell roughly if their vaccines were working to control covid-19.


back to top

7.  Number or % infected having full vaccination


This figure is quite important and significant. It might be able to tell how effective is the vaccine deployed by each country.  Unfortunately,  this figure is not easily available. This is because the figure will not help as many people vaccinated as possible. 

back to top

8.  The Growth Rate in % Against the Average

This figure is also important. It will tell whether a country has been successful in implementing its vaccination program.  The % of people vaccinated will  always decline with time.  There will come a time when people will loose interest. Either they have been vaccinated or they do not believe in vaccine.  For example,  Hong Kong's vaccination rate has come down lately. It is not healthy if the city has rising case of infection in the early days;  fortunately,  this is not the case. This kind of information is not easily available.


back to top

Note:   These are interactive chart with courtesy of ourworldindata.org.  They are extracted and embed here for easy reference.  User can "Add Country" to change the country name etc to get the required information

9.  Cumulative Numbers of Infected People and of those having taken Full Dose

This numbers are important because one can use it to work out the attack rate for the selected window as shown in the example of how to determine the vaccine efficacy

a)  The Cumulative Number of Infected People


 b) Total number of People having taken Full Dose


https://tinyurl.com/45k5tp78

iPhone and iPad: How to Create a Short Cut in Home Screen to Clear Cache & History

23 November 2024 What are Cache and History? Cache and browser history store information about websites you've visited.  The C ache s to...