Search This Blog

Wednesday, December 6, 2023

Simple and Easy Way To Backup Photos, Movies and Documents from handphones

 2 December 2023

In the past,  we used iTunes when we wanted to transfer or backup our photos,  movies, and documents from iPhones or Android phones to computers.  This is tedious, especially in iPhones.  Today,  we can use thumb drives quickly and easily. 

How?

We use Y-Disk Apps and a thumb drive

What needed?

a)  A special thumb drive that can use Y-Disk Apps and has the right connectors for your phones and PCs;  for example,  this thumb drive has the connectors for new and old iPhones and also the connectors for PCs


b)  Free Y-Disk Apps that can be downloaded from app stores.

How to Install?  

It is plug-and-play.  No installation is required except for the installation of the Y-Disk apps.

How to use it?

It is simple.  Just plug in the thumb drive and the phones will detect it if one has the Y-Disk apps already installed in the phones.    The app allows one to transfer photos such as jpg and png,  movies, and documents such as Excel files, etc depending on the design of the thumb drives


How Safe to use?

The software Y-Disk was developed by a Chinese company in Shenzhen.  Some users have expressed concerns about the security and privacy of using this app.   The AppleStore's App Privacy claims that the developer does not collect any data from this app.   However, it has been found that this app did store uploaded documents in its cache and the cache can only be erased when one uninstalls the app. 

Tuesday, December 5, 2023

Windows 10 & 11 : Missing Microsoft Store in Apps and Feature

 4 December 2023

When this will happen?

When one upgrades the Windows, one might find the Microsoft Store missing, or when one resets, deletes, or terminates the Microsoft Store in Apps and Features when one is finding solutions to resolve an app downloading problems


Why?

The Microsoft Store apps might be corrupted.

How to Fix?

One might spend hours or days trying to work on many suggestions on the net about how to go around restoring the missing Microsoft Store but to no avail.     If that is the case,  the following simple solution might just work.

How?

This simple solution makes use of app restoring feature available in Xbox Apps.  The steps to restore the Microsoft Store are listed below:

Step 1:  Do a Windows Update by clicking this website after choosing either Windows 10 or Windows 11 to update

Click here for the Windows update

Step 2:  Do an Xbox installation 

Click here to do an Xbos installation

Step 3: Download and Startup the Installation


Step 4: Click "Sign-in" on the top

A sign-in window will pop up.   Click setting


Step 5: Click Settings

If one has already signed into Microsoft when using Windows,  this screen will appear;  if not,  a sign-in would be required.  


Step 6:  Click General

In the following screen that popped up,  click to install Microsoft Apps


Step 7:  Go and check if the Microsoft Store is installed in Apps and Features.   

Step 8:  If everything is in order,  set a restore point to restore Windows in the future.


Saturday, December 2, 2023

Automation Error when running Selenium VBA on Excel

2 December 2023

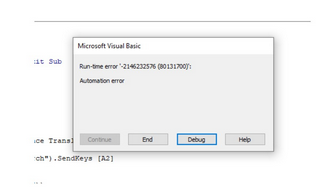
Chromedriver for SeleniumBasic was running fine before and returned "Automate Error" when Excel was upgraded.  


This error always happened when Excel started to run this macro statement

              driver.start "chrome", ""

Why?

This error will happen when the .NET Framework 3.5 is missing.   One would need to download and install framework 3.5 which is required by Selenium Chrome Driver.    

What could happen when installing .Net Framework 3.5?

 As .Net Framework 3.5 is pretty old software, it might be possible that Windows 10 might refuse to install .Net Framework 3.5.    When this happened,    one could install .Net Framework using the installation scripts that come together with  "SeleniumBasic-2.0.9.0".

After having run and install "SeleniumBasic-2.0.9.0",   go to  "C:\Users\%username%\AppData\Local\SeleniumBasic\Scripts\"  and run " StartChrome.vbs".  The scripts will the automatically download and install .Net Framework 3.5.

What if the above Won't Work?

The .NET Framework is an integral part of many applications running on Windows and provides common functionality for those applications to run. Normally, before running/installing such applications, 

It might be possible that .NET Frame could have already been installed but deactivated. This is especially true when one upgrades or reinstalls Windows 10 while keeping the personal files.   If this is the case,  one needs only to enable .NET Framework from the Control Panel on the compute as follows:

a) Press “Windows Logo” + “R” keys on the keyboard.
b) Type “appwiz.cpl” in the “Run” command box and press “ENTER”.
c) In the “Programs and Features” window, click on the link “Turn Windows features on or off”.
d) Check if the “.NET Framework 3.5 (includes .NET 2.0 and 3.0)” option is available in it.
e) If yes, then enable it and then click on “OK”.
f) Follow the on-screen instructions to complete the installation and restart the computer, if prompted.


Thursday, September 7, 2023

Where SembCorp's Price is Heading?

Jump to article

7 September 2023

SembCorp closed yesterday with a price of S$ 5.08 which is 2.7% down from Tuesday's closing price of S$ 5.22.   SembCorp's price has lost a total of S$1.01 or 17% since 7 August 2023 when the news about SembCorp being listed in MSCI Singapore was first spread in various forums.  

This article will try to find out where SembCorp's price might be heading.

The reason why SembCorp’s Price was Falling

In the last article dated 1 September, we explained that Sembcorp stock demand would increase when it rejoined the MSCI index.  This is due to an effect called  S&P Phenomenon.    Unfortunately,  this S&P Phenomenon did not cause SembCorp’s price to rise but fall because the MSCI Singapore had not been performing to its best lately.    

Will SembCorp’s Price Rise Soon?

Many traders were expecting SembCorp’s to rise sooner because it has fallen quite a lot and SembCorp has reported a sterling result for 1H2023  Some even speculated the price would rise even faster and quicker than before if history can repeat itself.  Let’s examine in this article if this is possible from the angle of Technical Analysis.

Technical Analysis

Unfortunately,   the Technical Analysis from the following chart is telling us a different story.   This is because there are at least 3 weaknesses in SembCorp's technical chart.

First,  we see a dead cross with 20-day MA cutting below 50-day MA;  then,  we see:

  •  The price cut below the 100-day MA;  
  •  A bear flag formed with a target price below  S$ 5.00

Fortunately,   the 100-day and 200-day are still rising.  This will give hope that SembCorp's price might have a chance to reverse its course if the prevailing condition is favorable.

Click to enlarge the picture
Figure 1


What about the Prevailing Conditions?

Unfortunately,  the prevailing conditions are not able to support SembCorp's price at the moment.  Let's examine the various relevant indexes that can support the rise of SembCorp's price.  

a)   The STI & The MSCI Singapore

Click to enlarge the picture
Figure 2

B
oth the STI and MSCI Singapore indexes are littered with a lot of dead crosses.  It is not hopeful that they can lend any support to push SembCorp's price up in the shorter term.


Figure 3


The Global Indexes

The US and Hong Kong markets used to have a lot of influence on Singapore's stock price but lately, the Hong Kong market was in a mess and the US market has begun to soften,  ready to make further corrections.  For example, the Dow Jones Industrial Index (DJI) has made 2 straight falls in the last 2 days.  It is ready to form a bear flag as shown in the following chart.  DOW has also started to make the first dead cross with the 20-day MA already crossing the 50-day MA.  We will expect DOW to make lower lows with the present setup.

Figure 4


Conclusion

Given the above,  we are expecting SembCorp's price to drop further to test not only Support  S3 @ S$ 5.01 but also Support S4 @ S$ 4.86 as shown in Figure 1 above.    If these 2 supports cannot hold the fall,  the price might test the bear flag target price @ S$ 4.58 which happened to be also the Support S5. 


Disclaimer:  This article is for information and educational purposes.   Readers are advised to conduct their own research and study to make their own investment decisions.


Monday, September 4, 2023

Where Hong Kong and Shanghai Bources Heading?

1 September  2023

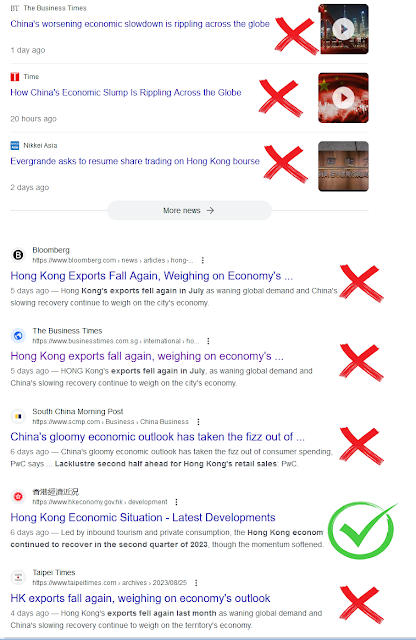
Using Google to search about the economy of Hong Kong and China,  we got the following picture


Seven out of the eight news have negative reports about Hong Kong and China's economy except one and only from the Hong Kong Government.   

In that report from the Hong Kong Government.  it pointed out that "real Gross Domestic Product (GDP) (of Hong Kong) grew by 1.5% year-on-year in the second quarter of 2023 after having increased by 2.9% in the preceding quarter. Nonetheless,  the report concluded by saying "the real GDP growth forecast for 2023 has been revised (upwards) to 4.0%-5.0%, from 3.5%-5.5% in May 2023"  

On the other hand,  the Chinese authorities in China have come up with various measures trying to lift the sentiments in the stock market and the business sectors,  including slashing the stock market trading fees. They are also trying to stimulate spending by cutting the bank deposit rate. 

This article will examine how the stock market has responded to all the measures and the propaganda done so far to uplift the market sentiments.


The  Shanghai Stock Market

The Shanghai market was performing pretty well before May 2023 and after China announced the re-opening of its borders in December 2022.  However,  the market soon started to fall apart in early May when there were reports about China's economy not performing as well as expected.  Also,  the retail sales of consumer goods were missing forecasts.  The Industrial output and foreign investment have slowed down.  

During the period between May and June 2023,  we saw the Shangai stock market lose more than 7%.  from 3,395 to 3,150 or about 250 points.  The market recovered a little when China vowed to come out with further measures to bolster the Chinese economy and lift the stock market performance.  These measures include slashing the stamp duties for IPOs,  reducing the stock trading fees, etc.  However,  these measures and efforts did not help much to lift the stock market because there was a slew of bad news about the economy not performing well and continuing to pump out.   

Technically speaking from the Shanghai Index chart shown below,  the Shanghai Index was littered with dead crosses all over (marked in the red circle).   

The more serious one appears to be the large red circle that shows the 20 MA breaking below 50 MA and the 20 MA and 50 MA breaking the 200 MA together at the same time on the same day.  That was just after 14 August  when Country Garden suspended trading in 11 of its onshore bonds with a forecast of USD7.16 billion in losses in the first half.  

The bad news about the bankruptcy filings of Evergrande in the US courts on 19 August further aggravated the market fall sending the Shanghai Index deeper into the red.  

The index tried to make an attempt to recover from the doom drum on 26 August but failed.


If we draw the Shanghai Index using candlesticks,  we can see that the Index struggled but failed to recover on 28 August 2023. That particular candlestick on 28 August covered up 2 candlestick gaps leaving one @ G1 behind to be covered in the future as shown in the following chart.


Given the above scenarios, we are not optimistic that the Shanghai Index will be able to recover from this recent fall and cause a reversal to happen soon. We are expecting the index to have a hard time climbing back to cover the gap at G1. Meanwhile, if the Shanghai index fails to break the resistance R1 @ 3,150 or goes above 20 MA, we are expecting it to seek lower lows that could go below 3.000.


What about Hong Kong HSI?

Presently, we saw HSI mimicking the pattern of the Shanghai stock market. It will aim to test the support trendline T3 if it fails to conquer and go above the resistance at Trendline T2,


Disclaimer:  This article is for information and educational purposes.   Readers are advised to conduct their own research and study to make their own investment decisions.


Wednesday, August 30, 2023

SembCorp to be listed in the MSCI Singapore index

Jump to article

1 September 2023 Update

This was the picture taken down by a forumer in the last few seconds during the 5-minute daily price settlement period on 31 August 2023.

click to enlarge the picture


The picture shows that the trading on SembCorp's share was very active during the last trading minute.  
The price at the closing time of 5:00 pm was S$5.44 and there were over 40 million shares placed at the price of S$5.36 just seconds away from the end of the 5-minute settlement time.  This is a drop of S$0.08 which is about 1.5%.  At the end of the settlement time,  the closing price for the day was S$5.35 with a total trading volume of 76,948,000 shares which is a record-breaking trading volume since 29 May 2020.    

According to historical data,  SembCorp had a trading volume of about 90 million on 6 June and 115 million trading volume on 29 May 2020.

Why high trading volume in 2020?

May 29 2020 was the time when SembCorp was delisted from MSCI Singapore Index

June 9 2020 was the time when SemCorp subscribed up to S$1.5bn of rights shares in SembCorp Marine (SMM) without any cash outlay.  It was estimated that SembCorp holders could get substantial benefits from the recapitalization of SMM.

Takeaways

1.  The listing and delisting of any stock in any index would bring about an S&P phenomenon in which there will always be a boost in trading volume; 

2.  The price of the stock may rise or fall depending on the condition of the prevailing market or the index;


back to top


29 August 2023


SembCorp to be listed in the MSCI index

There was an announcement that SembCorp will be listed in the MSCI index on 1 September 2023.  This news had excited many traders.  Some forumers said that the listing would lift the trading sentiments and cause SembCorp's price to go up.  However,  some forumers were not so optimistic.  This article will try to examine how the listing of SembCorp will affect SembCorp’s price before and after it has been listed on 1 September 2023.

What is the MSCI index?

MSCI index, also known as the Morgan Stanley Capital International Index, is a widely recognized market benchmark for global equity markets. It provides investors with a comprehensive snapshot of stock market performance by tracking the performance of a specific set of stocks or sectors in various countries.  It plays an important role in attracting foreign investment.  

How will it affect Newly listed stock?

Those stocks newly listed in the MSCI index will experience an increase in demand and trading volumes and the price of the stock will be affected.  Many global fund managers and International players often use the MSCI index as a guideline for allocating their investment portfolios in different countries.   They might also want to be involved in the trading activities of the MSCI-listed stocks for various reasons, such as window dressings to boost the financial reports. 

Will the price go up after being listed?

The inclusion in any kind of index will invariably lift the trading sentiments and may also provide a temporary boost from retail buying,  especially those from International buyers who are trading the index.  This phenomenon is called the “S&P phenomenon”.  

There is always a tendency for the stock price to temporarily rise following the announcement of its addition to the index. 

Did this S&P phenomenon Happen?

The answer is Yes.   It did happen on 7 August 2023 which is about 1 week before the actual announcement.  Then SembCorp’s price jumped about 9%. 

Although the actual announcement was on 14 August,  there were already some discussions in some forums about the MSCI inclusion way back on 7  August 2023.  Nonetheless,  on the day of the announcement on 14 August,   SembCorp’s price dropped about 2% as shown in the following plot


Will SembCorp’s Price go up after 1 September?

This will be anyone’s guess.    Presently,  the MSCI Singapore’s performance is not as good as the other global MSCI as shown in the following picture


The gross return since 1994 is only about half of the other global index


What about the Future of MSCI Singapore?

The future of MSCI Singapore does not look too bright either from the following chart.


We are seeing many dead crosses littering all over the chart.  In the latest week,  we saw the 20 MA and  100 MA crossing below the 200 MA and also the 20 MA crossing below the 50 MA.  The chart shows us that MSCI Singapore will be under tremendous pressure to recover from the recent fall.

Given the above,  we are not optimistic that SembCorp’s price will leap and bounce after 1 September.   The situation may improve if the global equity market turns for the better in the next quarter.


Disclaimer:  This article is for information and educational purposes.   Readers are advised to conduct their own research and study to make their own investment decisions.


Sunday, August 27, 2023

SembCorp Testing the Support S1

27 August 2023

The Pump and Dump sent SembCorp's price down by about 10% from a high of S$6.09 on 7 August to a low of S$5.19 on 23 August.  As expected,  it tested the support S1 @ S$5.24 and rebounded to close @ S$ 5.39 last Friday 25 August.

This article will examine the reason for the pump and dump action.  It will try to find out where SembCorp's price would be heading next.

The 1H2023 Financial Report

SembCorp reported a profit surge of 56.3% in 1H2023.    The profit surged mainly because SembCorp saved about S$1.25B due to the higher electricity tariff in Singapore.    This better income boosted the operating profit but the revenue was not as good as compared to 1H2022 as shown in this chart from Teleview.


The joy for the boost in profits in 1H2923 was shortlived and apparently, has been offset by a reduction in the current and quick ratio.  This "shortfall" in the company's short-term liquidity may be caused by an oversight in the accountant,  resulting in the current asset of the company being lower than the current liability.  

However,  this short-term liquidity problem would not have much financial implication for a big Corporation like SembCorp because most creditors would be willing to extend the debt payment period or change their credit terms if there is a request.

Teleview has also flagged that the Trailing 12-month (TTM) revenue was 3% below the year 2022. Again,  this difference is not going to have too much impact on the stock performance as long as SembCorp can show that it has the capability to meet the long-term goals.


Technically

We found SembCorp's price struggling to recover from the recent pump and dump.  The price hit the support S1 and rebounded strongly on Friday with a price rise of more than 2%.   

By this time,  many would have thought that SembCorp's price would be on its way to recovery but the attached chart is telling us not to be too optimistic.   This is because:-

a)  The price has broken the strong Trendline support T1;   it would have to climb back to cross Trendline T1 as the first step of the recovery process;  then.

b)   The textbook is telling us that the price must recover and go above the 61.8% Fibonacci retracement level to ensure that the stock has fully recovered. The 61.8% Fibonacci price is at S$5.78.  This is about +7% of the present price of S$5.39;  also.

c)   There is still no significant sign of any recovery in the global markets.  

Should the price not be able to satisfy the above 2 conditions,  we would expect the price to fall back again to test the support S2 and other supports below S1.  On its way down,  it would test the support at the 100-day moving average.

click to enlarge the chart


Disclaimer:  This article is for information and educational purposes.   Readers are advised to conduct their own research and study to make their own investment decisions.


Other Articles about SembCorp


Sunday, August 20, 2023

Where Keppel's Price Would be Heading Next?


20 July 2023

Keppel's price climbed from S$4.50 in February 2023  to an all-time high of  S$7.40 in August.  This is a price rise of about 65% in the last 6 months.   It is quite a price jump.

We are now beginning to witness Keppel starting to do a serious correction.  This is because Keppel’s price chart:

a)   has not only broken the supporting trendline T2, it has also broken the 50-day moving average;

b)   has it's the Bollinger band started to expand;

lastly,  we are beginning to see the global market prices doing their corrections.  The US market was down lately, and one US analyst expected the US market to correct as much as 10%.   We are also beginning to see the Chinese Economy losing its steam in the 2nd quarter of 2023.

(Note that we have been using the newer charting tool because the chart from investing.com has not been price adjusted for the distribution in specie (DIS) of SembCorp Marine shares in February 2023) 

When was the last Serious Correction?

The last serious correction happened in 2022.  That was when China's economy was badly affected by the zero Covid policy. Then there were protests going on in many cities against the Chinese Government.  

Reuter has this news report that China's 2022 economic growth was one of the worst on record.   

During that difficult period,  we have seen Keppel’s prices not only breaking the 50-day moving average but also touching the 200-day on 2 occasions (marked as Pt1 and Pt2 in the following chart).

But the news that China was about to end the zero Covid policy and open its doors towards the end of December 2022 lifted the market sentiment.   This has not only stopped Keppel’s prices from sliding further but also seen a 20% price jump in February 2023.  Since then,  Keppel's prices changed their track.  This is because the Chinese Economy was predicted by the official news to recover and run much faster in the post-Covid period  


Where would the Price be going? 

Moving forward,  we expect Keppel’s price to test S1 @ S$6.45.  This is also where the 100-day moving average is located.  It might want to test S2 @ S$ 6.25 if the global market condition has not improved.

For the moment, we expect Keppel’s price will leave the 200-day moving average alone,  not until the global market has turned for the worst.  This is because the Distribution in species (DIS) of Keppel Reit announced recently will resist the falls. 


When will be the right time to re-enter the market?

The technical book is advising us to wait until :

a)  the MACD and its signal line have completely closed up and started its upward climb just like those good days before,  plus,  most importantly; 

b)  the MACD's climb must be supported by a rising Chaikin Money flow to show that smart money is flowing into the market.

Presently,  the Keppel’s MACD and its signal line have a tendency of widening which could mean the fall might be extended;  also,  the falling of the Chaikin Money flow is supporting such a move.


Disclaimer:  This article is for information and educational purposes.   Readers are advised to conduct their own research and study to make their own investment decisions

Other related articles

a)  Singapore Stock:  Keppel Corporation Limited (SGX: BN4)


Tuesday, August 15, 2023

Is SembCorp Suffering from a Pump and Dump?

15 August 2023

SembCorp’s price rose about 8.8% from S$5.60 to S$6.09 in one single bounce on 7 August, breaking not only the symmetrical triangle but also making the All-Time-High price that many were hoping for.   Some traders attributed this price jump to the good 1H 2023 report that SembCorp just presented on 4 August.   Unfortunately, the price leaps and bounces turned out to be nothing but a “pump and dump” like exercise.  

What is a Pump and Dump?

It is a technique usually used by some rogue traders who want to make more money by pumping up the price of a stock and then dumping the stock they were holding at inflated prices.  As a result,  the price of the stock will go back down or even go below where the pumping of the stock started. 

Isn’t the Pump and Dump Scheme Illegal?

There are rules about the pump and dump scheme and the Authority has been warning people about such scheme being used.  For example SGX RegCo has warned about some illegal pump and dump schemes being spread in the Telegram Chat Group.

However, the “Pump and Dump” technique has never died.  It has been used all the time, and even on stocks such as Gamestop.   The use of such a technique is more prevalent in penny stocks where Corporate information is not always available.


Is this SembCorp’s Pump and Dump Case Illegal?

Most  Rule books are actually more referring to pump-and-dump schemes that manipulated the market and not the pump-and-dump technique used by rogue traders to earn some quick bucks.   There is nothing illegal about using the pump-and-dump technique if there is no evidence of market manipulation. 

A good example is GameStop Corp's pump and dump case.   Gamestop has a US$6.0 billion market cap today.  It was reported that an investor boosted the price of Gamestop from US$ 20 to US$483 in 2021.  The price fell soon after by 90% to US$53 in a few days.  Many traders lost their pants.  Federal Authorities were reported to have investigated but there were no results reported.  There was even a Congressional Hearing and some law sues. Those interested in the case can refer to this Wikipedia report.


In the case of SembCorp,  there were no reports so far about any market manipulation on the pump and dump exercise.  The trader(s) who pumped and dumped could be making use of the excellent news report of  SembCorp’s 1H 2023 result to carry out their work.   As the information is publicly available,   there is nothing illegal about using such information. 


More About SembCorp’s 1H2023 result

SembCorp announced a profit surge of 56.3% for its first-half 2023 report on 4 August 2023.  It was also reported that The most significant profit contributor to the surge is the conventional energy business.

From SembCorp's financial report,  we can extract the following 2 pictures.

Picture 1:  The balance sheet 


Picture 2:   The Income and Expense Report 


SembCorp's net profit was mainly from the lower gas costs.  There was a saving of about S$763 million YOY.  This amount is more than enough to cover the profit gained.  The higher cost of sale on HOH was 12.1% was seasonal.  Singapore weather is always colder toward the end of the year.

Hence,  if traders were observant and had studied SembCorp carefully,  they would have avoided this recent pump-and-dump exercise.


Technical Analysis

Technically,  we are seeing SembCorp’s price resting on the trendline T1 which has now turned into a support after the price has broken up on 7 August.  

We are expecting the price to make a rebound from the support although the picture may be a bit “shaky”.  This is because the price uptrend is still intact with MACD and Chaikin Money Flow in the positive region.  The exception is that the price has broken the 15-day moving average as shown in the following chart, 

Maybe if the global market condition is good,  SembCorp's price can rebounce from Trendline T1.  However,  the global market is not looking good at the moment.  It is about to do a serious correction.   

Should SembCorp's price decides to break the support T1,  we might expect it to test trendline  T2 and maybe even the supports, S1 and S2.


Disclaimer:  This article is for information and educational purposes.   Readers are advised to conduct their own research and study to make their own investment decisions.


Other Articles about SembCorp


Simple and Easy Way To Backup Photos, Movies and Documents from handphones

 2 December 2023 In the past,  we used iTunes when we wanted to transfer or backup our photos,  movies, and documents from iPhones or Androi...